
Page 661 - Demo
P. 661
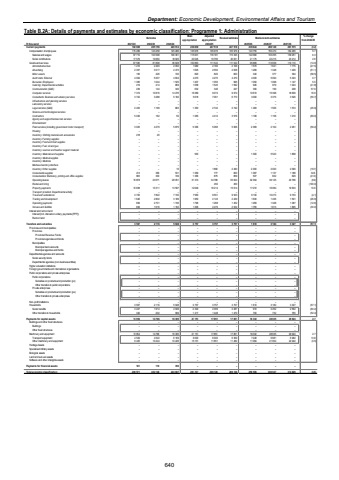
Department: Economic Development, Environmental Affairs and Tourism Table B.2A: Details of payments and estimates by economic classification: Programme 1: Administration Outcome Main appropriationAdjusted appropriation Revised estimate Medium-term estimates % change from 2024/25R thousand 2021/22 2022/23 2023/24 2025/26 2026/27 2027/28Current payments 182 869 205 156 220 914 236 839 247 518 247 518 239 644 269 128 281 575 (3.2)Compensation of employees 115 289 123 258 125 286 135 976 135 976 135 976 143 755 155 470 162 465 5.7Salaries and wages 97 710 103 598 106 361 115 931 116 181 115 345 122 580 133 255 139 251 6.3Social contributions 17 579 19 660 18 925 20 045 19 795 20 631 21 175 22 215 23 214 2.6Goods and services 67 580 81 898 95 628 100 863 111 542 111 542 95 889 113 658 119 110 (14.0)Administrative fees 1 216 2 493 2 050 1 980 2 166 2 166 1 570 1 641 1 715 (27.5)Advertising 2 357 3 017 2 473 1 625 2 550 2 638 1 289 1 348 1 409 (51.1)Minor assets 195 426 740 820 820 820 340 377 394 (58.5)Audit costs: External 4 094 5 007 4 604 4 270 4 270 4 270 4 300 5 094 5 323 0.7Bursaries: Employees 1 385 1 044 1 525 1 407 1 055 995 1 050 1 098 1 147 5.5Catering: Departmental activities 219 414 869 1 058 1 545 1 592 926 979 1 024 (41.8)Communication (G&S) 239 144 340 632 346 247 390 199 208 57.9Computer services 7 374 10 816 14 276 16 389 9 074 9 074 10 610 15 398 18 609 16.9Consultants: Business and advisory services 3 722 3 288 5 182 5 618 7 061 6 773 3 000 3 375 3 526 (55.7)Infrastructure and planning services %u2013 %u2013 %u2013 %u2013 %u2013 %u2013 %u2013 %u2013 %u2013Laboratory services %u2013 %u2013 %u2013 %u2013 %u2013 %u2013 %u2013 %u2013 %u2013Legal services (G&S) 2 452 1 199 863 1 363 2 742 2 742 1 483 1 506 1 574 (45.9)Science and technological services %u2013 %u2013 %u2013 %u2013 %u2013 %u2013 %u2013 %u2013 %u2013Contractors 5 046 162 50 1 065 4 412 3 576 1 108 1 158 1 210 (69.0)Agency and support/outsourced services %u2013 %u2013 %u2013 %u2013 %u2013 %u2013 %u2013 %u2013 %u2013Entertainment %u2013 %u2013 %u2013 %u2013 %u2013 %u2013 %u2013 %u2013 %u2013Fleet services (including government motor transport) 3 025 4 279 5 875 5 066 5 066 5 066 2 069 2 164 2 261 (59.2)Housing %u2013 %u2013 %u2013 %u2013 %u2013 %u2013 %u2013 %u2013 %u2013Inventory: Clothing material and accessories 218 20 %u2013 %u2013 %u2013 %u2013 %u2013 %u2013 %u2013Inventory: Farming supplies %u2013 %u2013 %u2013 %u2013 %u2013 %u2013 %u2013 %u2013 %u2013Inventory: Food and food supplies %u2013 %u2013 %u2013 %u2013 %u2013 %u2013 %u2013 %u2013 %u2013Inventory: Fuel, oil and gas %u2013 %u2013 %u2013 %u2013 %u2013 %u2013 %u2013 %u2013 %u2013Inventory: Learner and teacher support material %u2013 %u2013 %u2013 %u2013 %u2013 %u2013 %u2013 %u2013 %u2013Inventory: Materials and supplies %u2013 %u2013 %u2013 500 %u2013 %u2013 1 000 5 523 1 858Inventory: Medical supplies %u2013 %u2013 %u2013 %u2013 %u2013 %u2013 %u2013 %u2013 %u2013Inventory: Medicine %u2013 %u2013 %u2013 %u2013 %u2013 %u2013 %u2013 %u2013 %u2013Medsas inventory interface %u2013 %u2013 %u2013 %u2013 %u2013 %u2013 %u2013 %u2013 %u2013Inventory: Other supplies %u2013 %u2013 16 %u2013 1 890 2 490 2 000 2 000 2 090 (19.7)Consumable supplies 413 366 531 1 069 777 820 1 087 1 137 1 188 32.6Consumables: Stationery, printing and office supplies 995 300 749 1 366 875 859 507 602 629 (41.0)Operating leases 16 878 23 671 28 051 31 374 34 788 35 624 32 094 39 125 40 796 (9.9)Rental and hiring %u2013 %u2013 %u2013 %u2013 450 450 %u2013 %u2013 %u2013 (100.0)Property payments 10 838 10 311 13 597 12 649 16 214 15 614 17 272 16 084 19 633 10.6Transport provided: Departmental activity %u2013 %u2013 %u2013 %u2013 %u2013 %u2013 %u2013 %u2013 %u2013Travel and subsistence 3 720 7 822 7 740 7 560 9 551 9 523 9 130 10 273 9 733 (4.1)Training and development 1 646 2 802 3 189 1 950 2 143 2 229 1 630 1 436 1 501 (26.9)Operating payments 699 2 701 1 746 1 796 1 268 1 452 1 269 1 328 1 387 (12.6)Venues and facilities 849 1 616 1 162 1 306 2 479 2 522 1 765 1 813 1 895 (30.0)Interest and rent on land %u2013 %u2013 %u2013 %u2013 %u2013 %u2013 %u2013 %u2013 %u2013Interest (Incl. interest on unitary payments (PPP)) %u2013 %u2013 %u2013 %u2013 %u2013 %u2013 %u2013 %u2013 %u2013Rent on land %u2013 %u2013 %u2013 %u2013 %u2013 %u2013 %u2013 %u2013 %u2013Transfers and subsidies 3 567 2 116 5 948 3 757 3 757 3 757 1 610 3 184 3 327 (57.1)Provinces and municipalities %u2013 %u2013 %u2013 %u2013 %u2013 %u2013 %u2013 %u2013 %u2013Provinces %u2013 %u2013 %u2013 %u2013 %u2013 %u2013 %u2013 %u2013 %u2013Provincial Revenue Funds %u2013 %u2013 %u2013 %u2013 %u2013 %u2013 %u2013 %u2013 %u2013Provincial agencies and funds %u2013 %u2013 %u2013 %u2013 %u2013 %u2013 %u2013 %u2013 %u2013Municipalities %u2013 %u2013 %u2013 %u2013 %u2013 %u2013 %u2013 %u2013 %u2013Municipal bank accounts %u2013 %u2013 %u2013 %u2013 %u2013 %u2013 %u2013 %u2013 %u2013Municipal agencies and funds %u2013 %u2013 %u2013 %u2013 %u2013 %u2013 %u2013 %u2013 %u2013Departmental agencies and accounts %u2013 %u2013 %u2013 %u2013 %u2013 %u2013 %u2013 %u2013 %u2013Social security funds %u2013 %u2013 %u2013 %u2013 %u2013 %u2013 %u2013 %u2013 %u2013Departmental agencies (non-business entities) %u2013 %u2013 %u2013 %u2013 %u2013 %u2013 %u2013 %u2013 %u2013Higher education institutions %u2013 %u2013 %u2013 %u2013 %u2013 %u2013 %u2013 %u2013 %u2013Foreign governments and international organisations %u2013 %u2013 %u2013 %u2013 %u2013 %u2013 %u2013 %u2013 %u2013Public corporations and private enterprises %u2013 %u2013 %u2013 %u2013 %u2013 %u2013 %u2013 %u2013 %u2013Public corporations %u2013 %u2013 %u2013 %u2013 %u2013 %u2013 %u2013 %u2013 %u2013Subsidies on products and production (pc) %u2013 %u2013 %u2013 %u2013 %u2013 %u2013 %u2013 %u2013 %u2013Other transfers to public corporations %u2013 %u2013 %u2013 %u2013 %u2013 %u2013 %u2013 %u2013 %u2013Private enterprises %u2013 %u2013 %u2013 %u2013 %u2013 %u2013 %u2013 %u2013 %u2013Subsidies on products and production (pe) %u2013 %u2013 %u2013 %u2013 %u2013 %u2013 %u2013 %u2013 %u2013Other transfers to private enterprises %u2013 %u2013 %u2013 %u2013 %u2013 %u2013 %u2013 %u2013 %u2013Non-profit institutions %u2013 %u2013 %u2013 %u2013 %u2013 %u2013 %u2013 %u2013 %u2013Households 3 567 2 116 5 948 3 757 3 757 3 757 1 610 3 184 3 327 (57.1)Social benefits 3 227 1 914 4 949 2 340 2 309 2 287 910 2 452 2 562 (60.2)Other transfers to households 340 202 999 1 417 1 448 1 470 700 732 765 (52.4)Payments for capital assets 13 954 14 766 16 395 21 151 17 851 17 851 18 332 28 635 29 924 2.7Buildings and other fixed structures %u2013 %u2013 %u2013 %u2013 %u2013 %u2013 %u2013 %u2013 %u2013Buildings %u2013 %u2013 %u2013 %u2013 %u2013 %u2013 %u2013 %u2013 %u2013Other fixed structures %u2013 %u2013 %u2013 %u2013 %u2013 %u2013 %u2013 %u2013 %u2013Machinery and equipment 13 954 14 766 16 395 21 151 17 851 17 851 18 332 28 635 29 924 2.7Transport equipment 4 529 4 522 6 169 6 000 6 000 6 369 7 248 6 681 6 982 13.8Other machinery and equipment 9 425 10 244 10 226 15 151 11 851 11 482 11 084 21 954 22 942 (3.5)Heritage Assets %u2013 %u2013 %u2013 %u2013 %u2013 %u2013 %u2013 %u2013 %u2013Specialised military assets %u2013 %u2013 %u2013 %u2013 %u2013 %u2013 %u2013 %u2013 %u2013Biological assets %u2013 %u2013 %u2013 %u2013 %u2013 %u2013 %u2013 %u2013 %u2013Land and sub-soil assets %u2013 %u2013 %u2013 %u2013 %u2013 %u2013 %u2013 %u2013 %u2013Software and other intangible assets %u2013 %u2013 %u2013 %u2013 %u2013 %u2013 %u2013 %u2013 %u2013Payments for financial assets 181 110 350 %u2013 %u2013 %u2013 %u2013 %u2013 %u2013Total economic classification 200 571 222 148 243 607 261 747 269 126 269 126 259 586 300 947 314 826 (3.5)2024/25640
