
Page 660 - Demo
P. 660
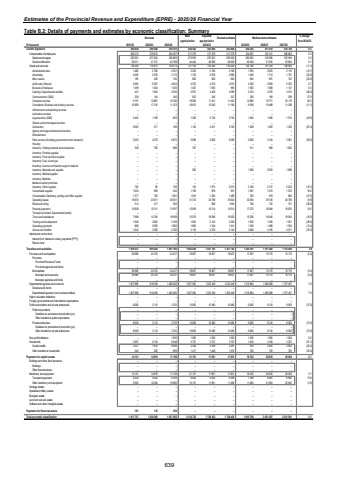
Estimates of the Provincial Revenue and Expenditure (EPRE) - 2025/26 Financial Year Table B.2: Details of payments and estimates by economic classification: Summary Outcome Main appropriationAdjusted appropriation Revised estimate Medium-term estimates % change from 2024/25R thousand 2021/22 2022/23 2023/24 2025/26 2026/27 2027/28Current payments 390 546 346 928 419 210 444 542 452 808 452 808 454 243 511 470 535 708 0.3Compensation of employees 260 572 279 673 294 637 317 379 317 379 317 379 334 097 370 131 386 803 5.3Salaries and wages 222 061 237 942 250 869 272 935 270 523 269 350 283 603 318 596 332 949 5.3Social contributions 38 511 41 731 43 768 44 444 46 856 48 029 50 494 51 535 53 854 5.1Goods and services 86 356 110 873 124 573 127 163 135 429 135 429 120 146 141 339 148 905 (11.3)Administrative fees 2 780 1 482 2 351 2 303 2 166 2 166 1 935 2 023 2 116 (10.7)Advertising 3 678 4 029 3 172 1 725 2 878 2 966 1 409 1 714 1 791 (52.5)Minor assets 426 195 740 820 820 820 640 691 722 (22.0)Audit costs: External 5 007 4 094 4 604 4 270 4 270 4 270 4 300 5 094 5 323 0.7Bursaries: Employees 1 399 1 044 1 525 1 407 1 055 995 1 050 1 098 1 147 5.5Catering: Departmental activities 447 1 604 3 036 2 972 4 429 4 596 2 474 3 076 3 215 (46.2)Communication (G&S) 239 144 340 632 346 247 390 199 208 57.9Computer services 9 197 12 861 16 326 18 506 11 431 11 424 14 880 19 771 23 179 30.3Consultants: Business and advisory services 10 969 17 216 11 473 16 812 12 040 11 184 9 938 10 488 11 366 (11.1)Infrastructure and planning services %u2013 %u2013 %u2013 %u2013 %u2013 %u2013 %u2013 %u2013 %u2013Laboratory services %u2013 %u2013 %u2013 %u2013 %u2013 %u2013 %u2013 %u2013 %u2013Legal services (G&S) 2 452 1 199 863 1 363 2 742 2 742 1 483 1 506 1 574 (45.9)Science and technological services %u2013 %u2013 %u2013 %u2013 %u2013 %u2013 %u2013 %u2013 %u2013Contractors 5 065 271 189 1 125 4 521 3 705 1 208 1 263 1 320 (67.4)Agency and support/outsourced services %u2013 %u2013 %u2013 %u2013 %u2013 %u2013 %u2013 %u2013 %u2013Entertainment %u2013 %u2013 %u2013 %u2013 %u2013 %u2013 %u2013 %u2013 %u2013Fleet services (including government motor transport) 3 025 4 279 5 875 5 066 5 066 5 066 2 069 2 164 2 261 (59.2)Housing %u2013 %u2013 %u2013 %u2013 %u2013 %u2013 %u2013 %u2013 %u2013Inventory: Clothing material and accessories 228 750 866 707 %u2013 %u2013 911 958 1 002Inventory: Farming supplies %u2013 %u2013 %u2013 %u2013 %u2013 %u2013 %u2013 %u2013 %u2013Inventory: Food and food supplies %u2013 %u2013 %u2013 %u2013 %u2013 %u2013 %u2013 %u2013 %u2013Inventory: Fuel, oil and gas %u2013 %u2013 %u2013 %u2013 %u2013 %u2013 %u2013 %u2013 %u2013Inventory: Learner and teacher support material %u2013 %u2013 %u2013 %u2013 %u2013 %u2013 %u2013 %u2013 %u2013Inventory: Materials and supplies %u2013 %u2013 %u2013 500 %u2013 %u2013 1 000 5 523 1 858Inventory: Medical supplies %u2013 %u2013 %u2013 %u2013 %u2013 %u2013 %u2013 %u2013 %u2013Inventory: Medicine %u2013 %u2013 %u2013 %u2013 %u2013 %u2013 %u2013 %u2013 %u2013Medsas inventory interface %u2013 %u2013 %u2013 %u2013 %u2013 %u2013 %u2013 %u2013 %u2013Inventory: Other supplies 720 96 706 120 1 973 2 573 2 160 2 137 2 233 (16.1)Consumable supplies 1 054 609 542 1 169 878 921 1 087 1 215 1 270 18.0Consumables: Stationery, printing and office supplies 1 377 765 1 081 1 616 1 505 1 489 782 919 960 (47.5)Operating leases 16 878 23 671 28 051 31 374 34 788 35 624 32 094 39 125 40 796 (9.9)Rental and hiring 514 417 505 %u2013 858 1 094 700 732 751 (36.0)Property payments 10 838 10 311 13 597 12 649 16 214 15 614 17 272 16 084 19 633 10.6Transport provided: Departmental activity %u2013 %u2013 %u2013 %u2013 %u2013 %u2013 %u2013 %u2013 %u2013Travel and subsistence 7 998 14 764 18 958 15 079 18 586 19 020 15 536 18 440 18 554 (18.3)Training and development 1 646 2 802 3 189 1 950 2 143 2 229 1 630 1 436 1 501 (26.9)Operating payments 868 2 929 1 802 1 882 1 344 1 541 1 350 1 488 1 554 (12.4)Venues and facilities 1 642 3 250 4 782 3 116 5 376 5 143 3 848 4 195 4 571 (25.2)Interest and rent on land %u2013 %u2013 %u2013 %u2013 %u2013 %u2013 %u2013 %u2013 %u2013Interest (Incl. interest on unitary payments (PPP)) %u2013 %u2013 %u2013 %u2013 %u2013 %u2013 %u2013 %u2013 %u2013Rent on land %u2013 %u2013 %u2013 %u2013 %u2013 %u2013 %u2013 %u2013 %u2013Transfers and subsidies 1 056 527 945 028 1 501 166 1 665 029 1 257 793 1 257 793 1 343 181 1 511 282 1 755 929 6.8 Provinces and municipalities 36 968 24 753 24 237 18 607 18 607 18 607 17 607 15 175 15 175 (5.4)Provinces %u2013 %u2013 %u2013 %u2013 %u2013 %u2013 %u2013 %u2013 %u2013Provincial Revenue Funds %u2013 %u2013 %u2013 %u2013 %u2013 %u2013 %u2013 %u2013 %u2013Provincial agencies and funds %u2013 %u2013 %u2013 %u2013 %u2013 %u2013 %u2013 %u2013 %u2013Municipalities 36 968 24 753 24 237 18 607 18 607 18 607 17 607 15 175 15 175 (5.4)Municipal bank accounts 36 968 24 753 24 237 18 607 18 607 18 607 17 607 15 175 15 175 (5.4)Municipal agencies and funds %u2013 %u2013 %u2013 %u2013 %u2013 %u2013 %u2013 %u2013 %u2013Departmental agencies and accounts 1 007 986 916 049 1 465 626 1 627 565 1 223 449 1 223 449 1 315 864 1 483 289 1 727 427 7.6Social security funds %u2013 %u2013 %u2013 %u2013 %u2013 %u2013 %u2013 %u2013 %u2013Departmental agencies (non-business entities) 1 007 986 916 049 1 465 626 1 627 565 1 223 449 1 223 449 1 315 864 1 483 289 1 727 427 7.6Higher education institutions %u2013 %u2013 %u2013 %u2013 %u2013 %u2013 %u2013 %u2013 %u2013Foreign governments and international organisations %u2013 %u2013 %u2013 %u2013 %u2013 %u2013 %u2013 %u2013 %u2013Public corporations and private enterprises 8 006 2 110 3 763 13 600 10 480 10 480 6 600 8 134 8 500 (37.0)Public corporations %u2013 %u2013 %u2013 %u2013 %u2013 %u2013 %u2013 %u2013 %u2013Subsidies on products and production (pc) %u2013 %u2013 %u2013 %u2013 %u2013 %u2013 %u2013 %u2013 %u2013Other transfers to public corporations %u2013 %u2013 %u2013 %u2013 %u2013 %u2013 %u2013 %u2013 %u2013Private enterprises 8 006 2 110 3 763 13 600 10 480 10 480 6 600 8 134 8 500 (37.0)Subsidies on products and production (pe) %u2013 %u2013 %u2013 %u2013 %u2013 %u2013 %u2013 %u2013 %u2013Other transfers to private enterprises 8 006 2 110 3 763 13 600 10 480 10 480 6 600 8 134 8 500 (37.0)Non-profit institutions %u2013 %u2013 1 592 1 500 1 500 1 500 1 500 1 500 1 500 0.0Households 3 567 2 116 5 948 3 757 3 757 3 757 1 610 3 184 3 327 (57.1)Social benefits 3 227 1 914 4 949 2 340 2 309 2 287 910 2 452 2 562 (60.2)Other transfers to households 340 202 999 1 417 1 448 1 470 700 732 765 (52.4)Payments for capital assets 14 121 14 816 17 129 21 151 17 851 17 851 18 332 28 635 29 924 2.7Buildings and other fixed structures %u2013 %u2013 %u2013 %u2013 %u2013 %u2013 %u2013 %u2013 %u2013Buildings %u2013 %u2013 %u2013 %u2013 %u2013 %u2013 %u2013 %u2013 %u2013Other fixed structures %u2013 %u2013 %u2013 %u2013 %u2013 %u2013 %u2013 %u2013 %u2013Machinery and equipment 14 121 14 816 17 129 21 151 17 851 17 851 18 332 28 635 29 924 2.7Transport equipment 4 529 4 522 6 169 6 000 6 000 6 369 7 248 6 681 6 982 13.8Other machinery and equipment 9 592 10 294 10 960 15 151 11 851 11 482 11 084 21 954 22 942 (3.5)Heritage Assets %u2013 %u2013 %u2013 %u2013 %u2013 %u2013 %u2013 %u2013 %u2013Specialised military assets %u2013 %u2013 %u2013 %u2013 %u2013 %u2013 %u2013 %u2013 %u2013Biological assets %u2013 %u2013 %u2013 %u2013 %u2013 %u2013 %u2013 %u2013 %u2013Land and sub-soil assets %u2013 %u2013 %u2013 %u2013 %u2013 %u2013 %u2013 %u2013 %u2013Software and other intangible assets %u2013 %u2013 %u2013 %u2013 %u2013 %u2013 %u2013 %u2013 %u2013Payments for financial assets 181 110 350 %u2013 %u2013 %u2013 %u2013 %u2013 %u2013Total economic classification 1 417 757 1 350 500 1 937 855 2 130 722 1 728 452 1 728 452 1 815 756 2 051 387 2 321 561 5.12024/25639
