
Page 659 - Demo
P. 659
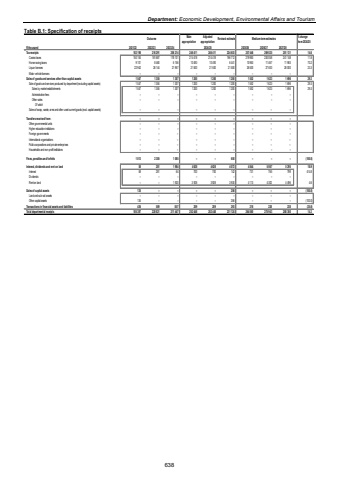
Department: Economic Development, Environmental Affairs and Tourism Table B.1: Specification of receipts Outcome Main appropriationAdjusted appropriation Revised estimate Medium-term estimates % change from 2024/25R thousand 2021/22 2022/23 2023/24 2025/26 2026/27 2027/28Tax receipts 216 291 182 198 206 214 246 411 246 411 224 653 257 446 269 025 281 131 14.6Casino taxes 181 687 150 155 178 101 214 418 214 418 196 712 219 983 230 058 241 148 11.8Horse racing taxes 8 460 9 101 6 156 10 493 10 493 6 441 10 963 11 467 11 983 70.2Liquor licences 26 144 22 942 21 957 21 500 21 500 21 500 26 500 27 500 28 000 23.3Motor vehicle licences %u2013 %u2013 %u2013 %u2013 %u2013 %u2013 %u2013 %u2013 %u2013 Sales of goods and services other than capital assets 1 547 1 355 1 307 1 200 1 200 1 200 1 552 1 623 1 696 29.3Sale of goods and services produced by department (excluding capital assets) 1 547 1 355 1 307 1 200 1 200 1 200 1 552 1 623 1 696 29.3Sales by market establishments 1 547 1 355 1 307 1 200 1 200 1 200 1 552 1 623 1 696 29.3Administrative fees %u2013 %u2013 %u2013 %u2013 %u2013 %u2013 %u2013 %u2013 %u2013Other sales %u2013 %u2013 %u2013 %u2013 %u2013 %u2013 %u2013 %u2013 %u2013Of whichSales of scrap, waste, arms and other used current goods (excl. capital assets) %u2013 %u2013 %u2013 %u2013 %u2013 %u2013 %u2013 %u2013 %u2013Transfers received from: %u2013 %u2013 %u2013 %u2013 %u2013 %u2013 %u2013 %u2013 %u2013Other governmental units %u2013 %u2013 %u2013 %u2013 %u2013 %u2013 %u2013 %u2013 %u2013Higher education institutions %u2013 %u2013 %u2013 %u2013 %u2013 %u2013 %u2013 %u2013 %u2013Foreign governments %u2013 %u2013 %u2013 %u2013 %u2013 %u2013 %u2013 %u2013 %u2013International organisations %u2013 %u2013 %u2013 %u2013 %u2013 %u2013 %u2013 %u2013 %u2013Public corporations and private enterprises %u2013 %u2013 %u2013 %u2013 %u2013 %u2013 %u2013 %u2013 %u2013Households and non-profit institutions %u2013 %u2013 %u2013 %u2013 %u2013 %u2013 %u2013 %u2013 %u2013Fines, penalties and forfeits 1 013 2 385 1 085 %u2013 %u2013 650 %u2013 %u2013 %u2013 (100.0)Interest, dividends and rent on land 58 281 1 984 4 628 4 628 4 072 4 844 5 067 5 295 18.9Interest 58 281 64 700 700 142 731 765 799 414.8Dividends %u2013 %u2013 %u2013 %u2013 %u2013 %u2013 %u2013 %u2013 %u2013Rent on land %u2013 %u2013 1 920 3 928 3 928 3 930 4 113 4 302 4 496 4.6Sales of capital assets 135 %u2013 %u2013 %u2013 %u2013 256 %u2013 %u2013 %u2013 (100.0)Land and sub-soil assets %u2013 %u2013 %u2013 %u2013 %u2013 %u2013 %u2013 %u2013 %u2013Other capital assets 135 %u2013 %u2013 %u2013 %u2013 256 %u2013 %u2013 %u2013 (100.0)Transactions in financial assets and liabilities 436 509 857 209 209 293 218 228 238 (25.6)Total departmental receipts 185 387 220 821 211 447 252 448 252 448 231 124 264 060 275 943 288 360 14.32024/25 638
