
Page 735 - Demo
P. 735
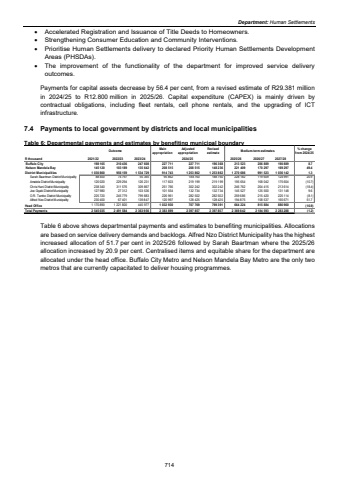
Department: Human Settlements %uf0b7 Accelerated Registration and Issuance of Title Deeds to Homeowners. %uf0b7 Strengthening Consumer Education and Community Interventions. %uf0b7 Prioritise Human Settlements delivery to declared Priority Human Settlements Development Areas (PHSDAs). %uf0b7 The improvement of the functionality of the department for improved service delivery outcomes. Payments for capital assets decrease by 56.4 per cent, from a revised estimate of R29.381 million in 2024/25 to R12.800 million in 2025/26. Capital expenditure (CAPEX) is mainly driven by contractual obligations, including fleet rentals, cell phone rentals, and the upgrading of ICT infrastructure. 7.4 Payments to local government by districts and local municipalities Table 6: Departmental payments and estimates by benefiting municipal boundary Outcome Main appropriationAdjusted appropriationRevised estimate Medium-term estimates % change from 2024/25R thousand 2021/22 2022/23 2023/24 2025/26 2026/27 2027/28 Buffalo City 198 165 210 436 247 608 227 711 227 711 196 368 213 523 206 889 190 889 8.7 Nelson Mandela Bay 145 120 103 189 135 642 208 515 208 515 148 236 221 409 170 297 169 297 49.4District Municipalities 1 030 860 956 159 1 534 729 914 743 1 253 862 1 253 862 1 270 686 991 523 1 036 142 1.3Sarah Baartman District Municipality 88 400 74 797 55 365 95 862 188 760 188 760 228 182 119 609 124 991 20.9Amatole District Municipality 120 020 229 294 126 231 117 603 219 199 219 199 195 654 168 042 175 604 (10.7)Chris Hani District Municipality 238 340 311 576 309 867 251 766 302 242 302 242 246 762 204 415 213 614 (18.4)Joe Gqabi District Municipality 127 980 27 312 103 536 101 554 132 734 132 734 145 527 125 500 131 148 9.6O.R. Tambo District Municipality 225 720 245 779 799 883 226 961 282 502 282 502 259 686 215 420 225 114 (8.1)Alfred Nzo District Municipality 230 400 67 401 139 847 120 997 128 425 128 425 194 875 158 537 165 671 51.7Head Office 1 170 890 1 221 800 445 977 1 032 930 707 769 799 391 664 224 815 884 886 960 (16.9)Total Payments 2 545 035 2 491 584 2 363 956 2 383 899 2 397 857 2 397 857 2 369 842 2 184 593 2 283 288 (1.2)2024/25 Table 6 above shows departmental payments and estimates to benefiting municipalities. Allocations are based on service delivery demands and backlogs. Alfred Nzo District Municipality has the highest increased allocation of 51.7 per cent in 2025/26 followed by Sarah Baartman where the 2025/26 allocation increased by 20.9 per cent. Centralised items and equitable share for the department are allocated under the head office. Buffalo City Metro and Nelson Mandela Bay Metro are the only two metros that are currently capacitated to deliver housing programmes. 714
