
Page 738 - Demo
P. 738
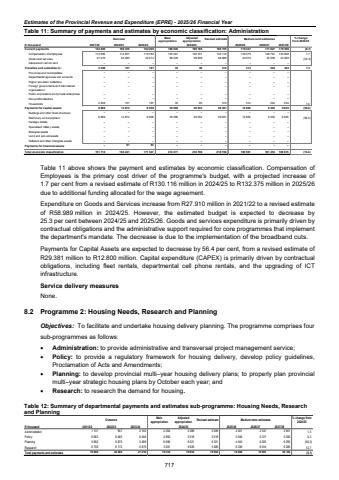
Estimates of the Provincial Revenue and Expenditure (EPRE) - 2025/26 Financial Year Table 11: Summary of payments and estimates by economic classification: Administration Outcome Main appropriationAdjusted appropriation Revised estimate Medium-term estimates % change from 2024/25R thousand 2021/22 2022/23 2023/24 2025/26 2026/27 2027/28Current payments 169 320 142 605 162 299 186 640 189 169 189 105 176 447 171 827 179 556 (6.7)Compensation of employees 114 837 114 695 119 785 130 391 130 331 130 116 132 375 129 791 135 628 1.7Goods and services 54 483 27 910 42 514 56 249 58 838 58 989 44 072 42 036 43 928 (25.3)Interest and rent on land %u2013 %u2013 %u2013 %u2013 %u2013 %u2013 %u2013 %u2013 %u2013 Transfers and subsidies to: 157 2 208 197 35 95 310 314 224 234 1.3Provinces and municipalities %u2013 %u2013 %u2013 %u2013 %u2013 %u2013 %u2013 %u2013 %u2013 Departmental agencies and accounts %u2013 %u2013 %u2013 %u2013 %u2013 %u2013 %u2013 %u2013 %u2013 Higher education institutions %u2013 %u2013 %u2013 %u2013 %u2013 %u2013 %u2013 %u2013 %u2013Foreign governments and international organisations %u2013 %u2013 %u2013 %u2013 %u2013 %u2013 %u2013 %u2013 %u2013Public corporations and private enterprises %u2013 %u2013 %u2013 %u2013 %u2013 %u2013 %u2013 %u2013 %u2013Non-profit institutions %u2013 %u2013 %u2013 %u2013 %u2013 %u2013 %u2013 %u2013 %u2013Households 2 208 157 197 35 95 310 314 234 224 1.3Payments for capital assets 6 899 14 874 8 958 25 596 29 532 29 381 12 800 9 825 9 402 (56.4)Buildings and other fixed structures %u2013 %u2013 %u2013 %u2013 %u2013 %u2013 %u2013 %u2013 %u2013Machinery and equipment 6 899 14 874 8 958 25 596 29 532 29 381 12 800 9 825 9 402 (56.4)Heritage Assets %u2013 %u2013 %u2013 %u2013 %u2013 %u2013 %u2013 %u2013 %u2013Specialised military assets %u2013 %u2013 %u2013 %u2013 %u2013 %u2013 %u2013 %u2013 %u2013Biological assets %u2013 %u2013 %u2013 %u2013 %u2013 %u2013 %u2013 %u2013 %u2013Land and sub-soil assets %u2013 %u2013 %u2013 %u2013 %u2013 %u2013 %u2013 %u2013 %u2013Software and other intangible assets %u2013 %u2013 %u2013 %u2013 %u2013 %u2013 %u2013 %u2013 %u2013Payments for financial assets %u2013 91 93 %u2013 %u2013 %u2013 %u2013 %u2013 %u2013Total economic classification 151 712 184 441 171 547 212 271 218 796 218 796 189 561 189 615 181 453 (13.4)2024/25 Table 11 above shows the payment and estimates by economic classification. Compensation of Employees is the primary cost driver of the programme's budget, with a projected increase of 1.7 per cent from a revised estimate of R130.116 million in 2024/25 to R132.375 million in 2025/26 due to additional funding allocated for the wage agreement. Expenditure on Goods and Services increase from R27.910 million in 2021/22 to a revised estimate of R58.989 million in 2024/25. However, the estimated budget is expected to decrease by 25.3 per cent between 2024/25 and 2025/26. Goods and services expenditure is primarily driven by contractual obligations and the administrative support required for core programmes that implement the department's mandate. The decrease is due to the implementation of the broadband cuts.Payments for Capital Assets are expected to decrease by 56.4 per cent, from a revised estimate of R29.381 million to R12.800 million. Capital expenditure (CAPEX) is primarily driven by contractual obligations, including fleet rentals, departmental cell phone rentals, and the upgrading of ICT infrastructure. Service delivery measures None. 8.2 Programme 2: Housing Needs, Research and Planning Objectives: To facilitate and undertake housing delivery planning. The programme comprises four sub-programmes as follows:%uf0b7 Administration: to provide administrative and transversal project management service; %uf0b7 Policy: to provide a regulatory framework for housing delivery, develop policy guidelines, Proclamation of Acts and Amendments; %uf0b7 Planning: to develop provincial multi%u2013year housing delivery plans; to properly plan provincial multi%u2013year strategic housing plans by October each year; and %uf0b7 Research: to research the demand for housing.Table 12: Summary of departmental payments and estimates sub-programme: Housing Needs, Research and Planning Outcome Main appropriationAdjusted appropriation Revised estimate Medium-term estimates % change from 2024/25R thousand 2021/22 2022/23 2023/24 2025/26 2026/27 2027/28Administration 957 1 137 2 192 2 264 2 389 2 389 2 421 2 537 2 651 1,3Policy 6 465 6 063 6 456 4 893 5 318 5 318 5 546 5 317 5 556 4,3Planning 6 870 5 850 5 489 6 696 6 521 6 521 4 543 6 023 6 293 (30,3)Research 6 172 6 758 6 873 5 501 5 626 5 626 6 339 6 014 6 285 12,7Total payments and estimates 20 464 19 808 21 010 19 354 19 854 19 854 18 849 19 891 20 785 (5,1)2024/25717
