
Page 737 - Demo
P. 737
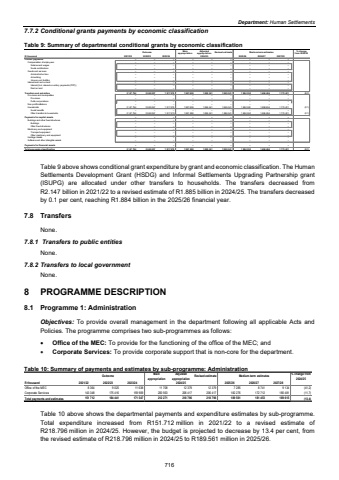
Department: Human Settlements 7.7.2 Conditional grants payments by economic classification Table 9: Summary of departmental conditional grants by economic classification Outcome Main appropriationAdjusted appropriation Revised estimate Medium-term estimates % change from 2024/25R thousand 2021/22 2022/23 2023/24 2025/26 2026/27 2027/28Current payments %u2013 %u2013 %u2013 %u2013 %u2013 %u2013 %u2013 %u2013 %u2013Compensation of employees %u2013 %u2013 %u2013 %u2013 %u2013 %u2013 %u2013 %u2013 %u2013Salaries and wages %u2013 %u2013 %u2013 %u2013 %u2013 %u2013 %u2013 %u2013 %u2013Social contributions %u2013 %u2013 %u2013 %u2013 %u2013 %u2013 %u2013 %u2013 %u2013Goods and services %u2013 %u2013 %u2013 %u2013 %u2013 %u2013 %u2013 %u2013 %u2013Administrative fees %u2013 %u2013 %u2013 %u2013 %u2013 %u2013 %u2013 %u2013 %u2013Advertising %u2013 %u2013 %u2013 %u2013 %u2013 %u2013 %u2013 %u2013 %u2013Venues and facilities %u2013 %u2013 %u2013 %u2013 %u2013 %u2013 %u2013 %u2013 %u2013Interest and rent on land %u2013 %u2013 %u2013 %u2013 %u2013 %u2013 %u2013 %u2013 %u2013Interest (Incl. interest on unitary payments (PPP)) %u2013 %u2013 %u2013 %u2013 %u2013 %u2013 %u2013 %u2013 %u2013Rent on land %u2013 %u2013 %u2013 %u2013 %u2013 %u2013 %u2013 %u2013 %u2013Transfers and subsidies 2 147 794 2 049 057 1 917 979 1 881 908 1 885 341 1 885 341 1 884 352 1 696 694 1 773 421 (0.1)Provinces and municipalities %u2013 %u2013 %u2013 %u2013 %u2013 %u2013 %u2013 %u2013 %u2013Provinces %u2013 %u2013 %u2013 %u2013 %u2013 %u2013 %u2013 %u2013 %u2013Public corporations %u2013 %u2013 %u2013 %u2013 %u2013 %u2013 %u2013 %u2013 %u2013Non-profit institutions %u2013 %u2013 %u2013 %u2013 %u2013 %u2013 %u2013 %u2013 %u2013Households 2 147 794 2 049 057 1 917 979 1 881 908 1 885 341 1 885 341 1 884 352 1 696 694 1 773 421 (0.1)Social benefits %u2013 %u2013 %u2013 %u2013 %u2013 %u2013 %u2013 %u2013 %u2013Other transfers to households 2 147 794 2 049 057 1 917 979 1 881 908 1 885 341 1 885 341 1 884 352 1 696 694 1 773 421 (0.1)Payments for capital assets %u2013 %u2013 %u2013 %u2013 %u2013 %u2013 %u2013 %u2013 %u2013Buildings and other fixed structures %u2013 %u2013 %u2013 %u2013 %u2013 %u2013 %u2013 %u2013 %u2013Buildings %u2013 %u2013 %u2013 %u2013 %u2013 %u2013 %u2013 %u2013 %u2013Other fixed structures %u2013 %u2013 %u2013 %u2013 %u2013 %u2013 %u2013 %u2013 %u2013Machinery and equipment %u2013 %u2013 %u2013 %u2013 %u2013 %u2013 %u2013 %u2013 %u2013Transport equipment %u2013 %u2013 %u2013 %u2013 %u2013 %u2013 %u2013 %u2013 %u2013Other machinery and equipment %u2013 %u2013 %u2013 %u2013 %u2013 %u2013 %u2013 %u2013 %u2013Heritage Assets %u2013 %u2013 %u2013 %u2013 %u2013 %u2013 %u2013 %u2013 %u2013Software and other intangible assets %u2013 %u2013 %u2013 %u2013 %u2013 %u2013 %u2013 %u2013 %u2013Payments for financial assets %u2013 %u2013 %u2013 %u2013 %u2013 %u2013 %u2013 %u2013 %u2013Total economic classification 2 147 794 2 049 057 1 917 979 1 881 908 1 885 341 1 885 341 1 884 352 1 696 694 1 773 421 (0.1)2024/25 Table 9 above shows conditional grant expenditure by grant and economic classification. The Human Settlements Development Grant (HSDG) and Informal Settlements Upgrading Partnership grant (ISUPG) are allocated under other transfers to households. The transfers decreased from R2.147 billion in 2021/22 to a revised estimate of R1.885 billion in 2024/25. The transfers decreased by 0.1 per cent, reaching R1.884 billion in the 2025/26 financial year. 7.8 Transfers None. 7.8.1 Transfers to public entities None. 7.8.2 Transfers to local government None. 8 PROGRAMME DESCRIPTION 8.1 Programme 1: Administration Objectives: To provide overall management in the department following all applicable Acts and Policies. The programme comprises two sub-programmes as follows: %uf0b7 Office of the MEC: To provide for the functioning of the office of the MEC; and %uf0b7 Corporate Services: To provide corporate support that is non-core for the department.Table 10: Summary of payments and estimates by sub-programme: Administration Outcome Main appropriationAdjusted appropriation Revised estimate Medium-term estimates % change from 2024/25R thousand 2021/22 2022/23 2023/24 2025/26 2026/27 2027/28Office of the MEC 9 025 8 364 11 638 11 708 12 379 12 379 7 285 8 741 9 134 (41,2)Corporate Services 175 416 143 348 159 909 200 563 206 417 206 417 182 276 172 712 180 481 (11,7)Total payments and estimates 184 441 151 712 171 547 212 271 218 796 218 796 189 561 181 453 189 615 (13,4)2024/25 Table 10 above shows the departmental payments and expenditure estimates by sub-programme. Total expenditure increased from R151.712 million in 2021/22 to a revised estimate of R218.796 million in 2024/25. However, the budget is projected to decrease by 13.4 per cent, from the revised estimate of R218.796 million in 2024/25 to R189.561 million in 2025/26. 716
