
Page 740 - Demo
P. 740
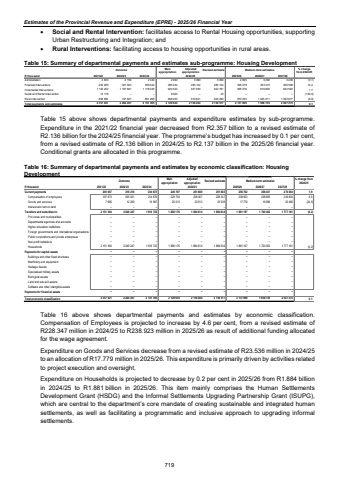
Estimates of the Provincial Revenue and Expenditure (EPRE) - 2025/26 Financial Year %uf0b7 Social and Rental Intervention: facilitates access to Rental Housing opportunities, supporting Urban Restructuring and Integration; and %uf0b7 Rural Interventions: facilitating access to housing opportunities in rural areas. Table 15: Summary of departmental payments and estimates sub-programme: Housing Development Outcome Main appropriationAdjusted appropriation Revised estimate Medium-term estimates % change from 2024/25R thousand 2021/22 2022/23 2023/24 2025/26 2026/27 2027/28Administration 2 156 2 803 2 440 2 990 3 090 3 090 2 995 3 290 3 438 (3.1)Financial Interventions 327 003 293 905 309 424 285 224 285 124 285 124 326 278 293 373 306 598 14.4Incremental Interventions 1 197 691 1 149 252 1 178 245 924 523 937 459 922 781 938 376 616 805 644 562 1.7Social and Rental Intervention %u2013 14 176 %u2013 9 003 %u2013 23 %u2013 %u2013 %u2013 (100.0)Rural Intervention 737 607 896 885 661 286 908 203 910 821 925 499 870 250 1 045 271 1 092 677 (6.0)Total payments and estimates 2 264 457 2 357 021 2 151 395 2 129 943 2 136 494 2 136 517 2 137 899 1 958 739 2 047 275 0.12024/25 Table 15 above shows departmental payments and expenditure estimates by sub-programme. Expenditure in the 2021/22 financial year decreased from R2.357 billion to a revised estimate of R2.136 billion for the 2024/25 financial year. The programme%u2019s budget has increased by 0.1 per cent, from a revised estimate of R2.136 billion in 2024/25 to R2.137 billion in the 2025/26 financial year. Conditional grants are allocated in this programme. Table 16: Summary of departmental payments and estimates by economic classification: Housing Development Outcome Main appropriationAdjusted appropriation Revised estimate Medium-term estimates % change from 2024/25R thousand 2021/22 2022/23 2023/24 2025/26 2026/27 2027/28Current payments 218 210 205 657 234 673 249 767 251 880 251 883 256 702 258 437 270 084 1,9Compensation of employees 206 001 197 672 214 676 229 754 228 367 228 347 238 923 238 839 249 604 4,6Goods and services 12 209 7 985 19 997 20 013 23 513 23 536 17 779 19 598 20 480 (24,5)Interest and rent on land %u2013 %u2013 %u2013 %u2013 %u2013 %u2013 %u2013 %u2013 %u2013Transfers and subsidies to: 2 151 364 2 046 247 1 916 722 1 880 176 1 884 614 1 884 634 1 881 197 1 700 302 1 777 191 (0,2)Provinces and municipalities %u2013 %u2013 %u2013 %u2013 %u2013 %u2013 %u2013 %u2013 %u2013Departmental agencies and accounts %u2013 %u2013 %u2013 %u2013 %u2013 %u2013 %u2013 %u2013 %u2013Higher education institutions %u2013 %u2013 %u2013 %u2013 %u2013 %u2013 %u2013 %u2013 %u2013Foreign governments and international organisations %u2013 %u2013 %u2013 %u2013 %u2013 %u2013 %u2013 %u2013 %u2013Public corporations and private enterprises %u2013 %u2013 %u2013 %u2013 %u2013 %u2013 %u2013 %u2013 %u2013Non-profit institutions %u2013 %u2013 %u2013 %u2013 %u2013 %u2013 %u2013 %u2013 %u2013Households 2 151 364 2 046 247 1 916 722 1 880 176 1 884 614 1 884 634 1 881 197 1 700 302 1 777 191 (0,2)Payments for capital assets %u2013 %u2013 %u2013 %u2013 %u2013 %u2013 %u2013 %u2013 %u2013Buildings and other fixed structures %u2013 %u2013 %u2013 %u2013 %u2013 %u2013 %u2013 %u2013 %u2013Machinery and equipment %u2013 %u2013 %u2013 %u2013 %u2013 %u2013 %u2013 %u2013 %u2013Heritage Assets %u2013 %u2013 %u2013 %u2013 %u2013 %u2013 %u2013 %u2013 %u2013Specialised military assets %u2013 %u2013 %u2013 %u2013 %u2013 %u2013 %u2013 %u2013 %u2013Biological assets %u2013 %u2013 %u2013 %u2013 %u2013 %u2013 %u2013 %u2013 %u2013Land and sub-soil assets %u2013 %u2013 %u2013 %u2013 %u2013 %u2013 %u2013 %u2013 %u2013Software and other intangible assets %u2013 %u2013 %u2013 %u2013 %u2013 %u2013 %u2013 %u2013 %u2013Payments for financial assets %u2013 %u2013 %u2013 %u2013 %u2013 %u2013 %u2013 %u2013 %u2013Total economic classification 2 357 021 2 264 457 2 151 395 2 129 943 2 136 494 2 136 517 2 137 899 1 958 739 2 047 275 0,12024/25 Table 16 above shows departmental payments and estimates by economic classification. Compensation of Employees is projected to increase by 4.6 per cent, from a revised estimate of R228.347 million in 2024/25 to R238.923 million in 2025/26 as result of additional funding allocated for the wage agreement. Expenditure on Goods and Services decrease from a revised estimate of R23.536 million in 2024/25 to an allocation of R17.779 million in 2025/26. This expenditure is primarily driven by activities related to project execution and oversight. Expenditure on Households is projected to decrease by 0.2 per cent in 2025/26 from R1.884 billion in 2024/25 to R1.881 billion in 2025/26. This item mainly comprises the Human Settlements Development Grant (HSDG) and the Informal Settlements Upgrading Partnership Grant (ISUPG), which are central to the department%u2019s core mandate of creating sustainable and integrated human settlements, as well as facilitating a programmatic and inclusive approach to upgrading informal settlements. 719
