
Page 78 - Demo
P. 78
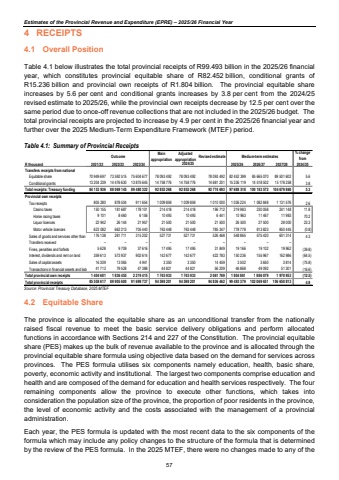
Estimates of the Provincial Revenue and Expenditure (EPRE) %u2013 2025/26 Financial Year4 RECEIPTS 4.1 Overall Position Table 4.1 below illustrates the total provincial receipts of R99.493 billion in the 2025/26 financial year, which constitutes provincial equitable share of R82.452 billion, conditional grants of R15.236 billion and provincial own receipts of R1.804 billion. The provincial equitable share increases by 5.6 per cent and conditional grants increases by 3.8 per cent from the 2024/25 revised estimate to 2025/26, while the provincial own receipts decrease by 12.5 per cent over the same period due to once-off revenue collections that are not included in the 2025/26 budget. The total provincial receipts are projected to increase by 4.9 per cent in the 2025/26 financial year and further over the 2025 Medium%u2010Term Expenditure Framework (MTEF) period. Table 4.1: Summary of Provincial Receipts Outcome Main appropriationAdjusted appropriation Revised estimate Medium-term estimatesR thousand 2021/22 2022/23 2023/24 2025/26 2026/27 2027/28Transfers receipts from nationalEquitable share 70 949 697 73 592 515 75 604 677 78 093 492 78 093 492 78 093 492 82 452 399 85 665 070 89 501 602 5.6Conditional grants 13 204 239 14 476 630 13 875 645 14 758 776 14 758 776 14 681 201 15 236 119 14 518 502 15 178 258 3.8Total receipts: Treasury funding 84 153 936 88 069 145 89 480 322 92 852 268 92 852 268 92 774 693 97 688 518 100 183 572 104 679 860 5.3Provincial own receiptsTax receipts 805 280 878 504 911 654 1 009 859 1 009 859 1 010 000 1 036 224 1 082 848 1 131 576 2.6Casino taxes 150 155 181 687 178 101 214 418 214 418 196 712 219 983 230 058 241 148 11.8Horse racing taxes 9 101 8 460 6 156 10 493 10 493 6 441 10 963 11 467 11 983 70.2Liquor licences 22 942 26 144 21 957 21 500 21 500 21 500 26 500 27 500 28 000 23.3Motor vehicle licences 623 082 662 213 705 440 763 448 763 448 785 347 778 778 813 823 850 445 (0.8)Sales of goods and services other than 176 138 281 711 315 202 527 731 527 731 526 468 548 865 575 420 601 314 4.3Transfers received %u2013 %u2013 %u2013 %u2013 %u2013 %u2013 %u2013 %u2013 %u2013 Fines, penalties and forfeits 5 628 9 709 37 616 17 495 17 495 31 849 19 166 19 102 19 962 (39.8)Interest, dividends and rent on land 359 613 573 937 902 614 142 677 142 677 422 783 150 236 155 967 162 986 (64.5)Sales of capital assets 16 309 13 065 4 941 3 350 3 350 14 459 3 502 3 650 3 814 (75.8)Transactions in financial assets and liab 79 528 41 713 47 388 44 821 44 821 56 209 46 868 49 092 51 301 (16.6)Total provincial own receipts 1 404 681 1 836 455 2 219 415 1 745 933 1 745 933 2 061 769 1 804 861 1 886 079 1 970 953 (12.5)Total provincial receipts 85 558 617 89 905 600 91 699 737 94 598 201 94 598 201 94 836 462 99 493 379 102 069 651 106 650 813 4.92024/25% change from 2024/25Source: Provincial Treasury Database, 2025 MTEF 4.2 Equitable Share The province is allocated the equitable share as an unconditional transfer from the nationally raised fiscal revenue to meet the basic service delivery obligations and perform allocated functions in accordance with Sections 214 and 227 of the Constitution. The provincial equitable share (PES) makes up the bulk of revenue available to the province and is allocated through the provincial equitable share formula using objective data based on the demand for services across provinces. The PES formula utilises six components namely education, health, basic share,poverty, economic activity and institutional. The largest two components comprise education and health and are composed of the demand for education and health services respectively. The four remaining components allow the province to execute other functions, which takes into consideration the population size of the province, the proportion of poor residents in the province, the level of economic activity and the costs associated with the management of a provincial administration. Each year, the PES formula is updated with the most recent data to the six components of the formula which may include any policy changes to the structure of the formula that is determined by the review of the PES formula. In the 2025 MTEF, there were no changes made to any of the 57
