
Page 813 - Demo
P. 813
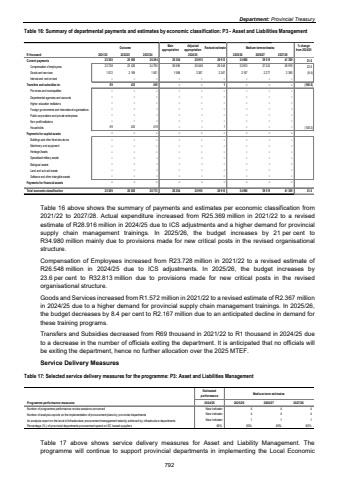
Department: Provincial Treasury Table 16: Summary of departmental payments and estimates by economic classification: P3 - Asset and Liabilities Management Outcome Main appropriationAdjusted appropriation Revised estimate Medium-term estimates % change from 2024/25R thousand 2021/22 2022/23 2023/24 2025/26 2026/27 2027/28Current payments 25 595 25 300 26 294 28 284 28 915 28 915 34 980 39 519 41 309 21.0Compensation of employees 23 426 23 728 24 793 26 696 26 548 26 548 32 813 37 242 38 919 23.6Goods and services 2 169 1 572 1 501 1 588 2 367 2 367 2 167 2 277 2 390 (8.4)Interest and rent on land %u2013 %u2013 %u2013 %u2013 %u2013 %u2013 %u2013 %u2013 %u2013 Transfers and subsidies to: 433 69 419 %u2013 %u2013 1 %u2013 %u2013 %u2013 (100.0)Provinces and municipalities %u2013 %u2013 %u2013 %u2013 %u2013 %u2013 %u2013 %u2013 %u2013 Departmental agencies and accounts %u2013 %u2013 %u2013 %u2013 %u2013 %u2013 %u2013 %u2013 %u2013 Higher education institutions %u2013 %u2013 %u2013 %u2013 %u2013 %u2013 %u2013 %u2013 %u2013Foreign governments and international organisations %u2013 %u2013 %u2013 %u2013 %u2013 %u2013 %u2013 %u2013 %u2013Public corporations and private enterprises %u2013 %u2013 %u2013 %u2013 %u2013 %u2013 %u2013 %u2013 %u2013Non-profit institutions %u2013 %u2013 %u2013 %u2013 %u2013 %u2013 %u2013 %u2013 %u2013Households 69 433 419 %u2013 %u2013 1 %u2013 %u2013 %u2013 (100.0)Payments for capital assets %u2013 %u2013 %u2013 %u2013 %u2013 %u2013 %u2013 %u2013 %u2013Buildings and other fixed structures %u2013 %u2013 %u2013 %u2013 %u2013 %u2013 %u2013 %u2013 %u2013Machinery and equipment %u2013 %u2013 %u2013 %u2013 %u2013 %u2013 %u2013 %u2013 %u2013Heritage Assets %u2013 %u2013 %u2013 %u2013 %u2013 %u2013 %u2013 %u2013 %u2013Specialised military assets %u2013 %u2013 %u2013 %u2013 %u2013 %u2013 %u2013 %u2013 %u2013Biological assets %u2013 %u2013 %u2013 %u2013 %u2013 %u2013 %u2013 %u2013 %u2013Land and sub-soil assets %u2013 %u2013 %u2013 %u2013 %u2013 %u2013 %u2013 %u2013 %u2013Software and other intangible assets %u2013 %u2013 %u2013 %u2013 %u2013 %u2013 %u2013 %u2013 %u2013Payments for financial assets %u2013 %u2013 %u2013 %u2013 %u2013 %u2013 %u2013 %u2013 %u2013Total economic classification 25 369 26 028 26 713 28 284 28 915 28 916 34 980 39 519 41 309 21.02024/25Table 16 above shows the summary of payments and estimates per economic classification from 2021/22 to 2027/28. Actual expenditure increased from R25.369 million in 2021/22 to a revised estimate of R28.916 million in 2024/25 due to ICS adjustments and a higher demand for provincial supply chain management trainings. In 2025/26, the budget increases by 21 per cent to R34.980 million mainly due to provisions made for new critical posts in the revised organisational structure. Compensation of Employees increased from R23.728 million in 2021/22 to a revised estimate of R26.548 million in 2024/25 due to ICS adjustments. In 2025/26, the budget increases by 23.6 per cent to R32.813 million due to provisions made for new critical posts in the revised organisational structure. Goods and Services increased from R1.572 million in 2021/22 to a revised estimate of R2.367 million in 2024/25 due to a higher demand for provincial supply chain management trainings. In 2025/26, the budget decreases by 8.4 per cent to R2.167 million due to an anticipated decline in demand for these training programs. Transfers and Subsidies decreased from R69 thousand in 2021/22 to R1 thousand in 2024/25 due to a decrease in the number of officials exiting the department. It is anticipated that no officials will be exiting the department, hence no further allocation over the 2025 MTEF. Service Delivery Measures Table 17: Selected service delivery measures for the programme: P3: Asset and Liabilities Management Estimatedperformance Medium-term estimatesProgramme performance measures 2024/25 2025/26 2026/27 2027/28Number of programme performance review sessions convened New Indicator 4 4 4Number of analysis reports on the implementation of procurement plans by provincial departments New Indicator 4 4 4An analysis report on the level of infrastructure procurement management maturity achieved by infrastructure departments New Indicator 1 1 1Percentage (% ) of provincial departments procurement spend on EC based suppliers 60% 60% 60% 60%Table 17 above shows service delivery measures for Asset and Liability Management. The programme will continue to support provincial departments in implementing the Local Economic 792
