
Page 811 - Demo
P. 811
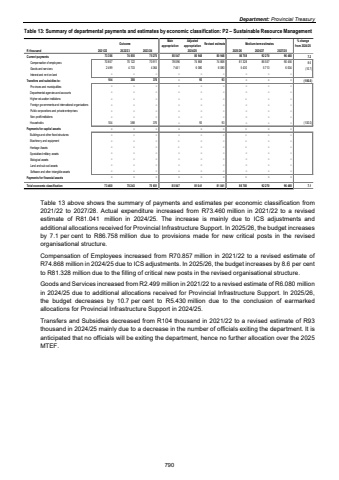
Department: Provincial Treasury Table 13: Summary of departmental payments and estimates by economic classification: P2 %u2013 Sustainable Resource Management Outcome Main appropriationAdjusted appropriation Revised estimate Medium-term estimates % change from 2024/25R thousand 2021/22 2022/23 2023/24 2025/26 2026/27 2027/28Current payments 73 356 74 855 75 275 85 547 80 948 80 948 86 758 92 270 96 460 7.2Compensation of employees 70 857 70 122 70 911 78 096 74 868 74 868 81 328 86 557 90 456 8.6Goods and services 2 499 4 733 4 364 7 451 6 080 6 080 5 430 5 713 6 004 (10.7)Interest and rent on land %u2013 %u2013 %u2013 %u2013 %u2013 %u2013 %u2013 %u2013 %u2013Transfers and subsidies to: 104 388 376 %u2013 93 93 %u2013 %u2013 %u2013 (100.0)Provinces and municipalities %u2013 %u2013 %u2013 %u2013 %u2013 %u2013 %u2013 %u2013 %u2013Departmental agencies and accounts %u2013 %u2013 %u2013 %u2013 %u2013 %u2013 %u2013 %u2013 %u2013Higher education institutions %u2013 %u2013 %u2013 %u2013 %u2013 %u2013 %u2013 %u2013 %u2013Foreign governments and international organisations %u2013 %u2013 %u2013 %u2013 %u2013 %u2013 %u2013 %u2013 %u2013Public corporations and private enterprises %u2013 %u2013 %u2013 %u2013 %u2013 %u2013 %u2013 %u2013 %u2013Non-profit institutions %u2013 %u2013 %u2013 %u2013 %u2013 %u2013 %u2013 %u2013 %u2013Households 104 388 376 %u2013 93 93 %u2013 %u2013 %u2013 (100.0)Payments for capital assets %u2013 %u2013 %u2013 %u2013 %u2013 %u2013 %u2013 %u2013 %u2013Buildings and other fixed structures %u2013 %u2013 %u2013 %u2013 %u2013 %u2013 %u2013 %u2013 %u2013Machinery and equipment %u2013 %u2013 %u2013 %u2013 %u2013 %u2013 %u2013 %u2013 %u2013Heritage Assets %u2013 %u2013 %u2013 %u2013 %u2013 %u2013 %u2013 %u2013 %u2013Specialised military assets %u2013 %u2013 %u2013 %u2013 %u2013 %u2013 %u2013 %u2013 %u2013Biological assets %u2013 %u2013 %u2013 %u2013 %u2013 %u2013 %u2013 %u2013 %u2013Land and sub-soil assets %u2013 %u2013 %u2013 %u2013 %u2013 %u2013 %u2013 %u2013 %u2013Software and other intangible assets %u2013 %u2013 %u2013 %u2013 %u2013 %u2013 %u2013 %u2013 %u2013Payments for financial assets %u2013 %u2013 %u2013 %u2013 %u2013 %u2013 %u2013 %u2013 %u2013Total economic classification 73 460 75 243 75 651 85 547 81 041 81 041 86 758 92 270 96 460 7.12024/25Table 13 above shows the summary of payments and estimates per economic classification from 2021/22 to 2027/28. Actual expenditure increased from R73.460 million in 2021/22 to a revised estimate of R81.041 million in 2024/25. The increase is mainly due to ICS adjustments and additional allocations received for Provincial Infrastructure Support. In 2025/26, the budget increases by 7.1 per cent to R86.758 million due to provisions made for new critical posts in the revised organisational structure. Compensation of Employees increased from R70.857 million in 2021/22 to a revised estimate of R74.868 million in 2024/25 due to ICS adjustments. In 2025/26, the budget increases by 8.6 per cent to R81.328 million due to the filling of critical new posts in the revised organisational structure.Goods and Services increased from R2.499 million in 2021/22 to a revised estimate of R6.080 million in 2024/25 due to additional allocations received for Provincial Infrastructure Support. In 2025/26, the budget decreases by 10.7 per cent to R5.430 million due to the conclusion of earmarked allocations for Provincial Infrastructure Support in 2024/25. Transfers and Subsidies decreased from R104 thousand in 2021/22 to a revised estimate of R93 thousand in 2024/25 mainly due to a decrease in the number of officials exiting the department. It is anticipated that no officials will be exiting the department, hence no further allocation over the 2025 MTEF. 790
