
Page 817 - Demo
P. 817
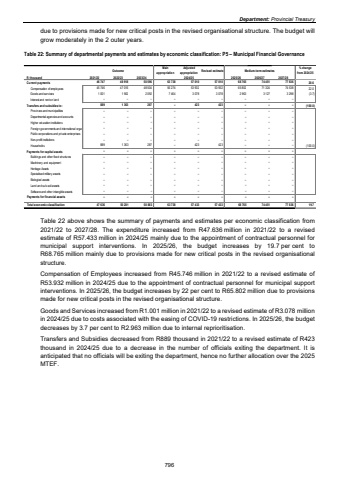
Department: Provincial Treasury due to provisions made for new critical posts in the revised organisational structure. The budget will grow moderately in the 2 outer years. Table 22: Summary of departmental payments and estimates by economic classification: P5 %u2013 Municipal Financial Governance Outcome Main appropriationAdjusted appropriation Revised estimate Medium-term estimates % change from 2024/25R thousand 2021/22 2022/23 2023/24 2025/26 2026/27 2027/28Current payments 46 747 48 918 50 596 63 738 57 010 57 010 68 765 74 451 77 836 20.6Compensation of employees 45 746 47 016 48 504 56 274 53 932 53 932 65 802 71 324 74 538 22.0Goods and services 1 001 1 902 2 092 7 464 3 078 3 078 2 963 3 127 3 298 (3.7)Interest and rent on land %u2013 %u2013 %u2013 %u2013 %u2013 %u2013 %u2013 %u2013 %u2013Transfers and subsidies to: 889 1 363 287 %u2013 423 423 %u2013 %u2013 %u2013 (100.0)Provinces and municipalities %u2013 %u2013 %u2013 %u2013 %u2013 %u2013 %u2013 %u2013 %u2013Departmental agencies and accounts %u2013 %u2013 %u2013 %u2013 %u2013 %u2013 %u2013 %u2013 %u2013Higher education institutions %u2013 %u2013 %u2013 %u2013 %u2013 %u2013 %u2013 %u2013 %u2013Foreign governments and international organ %u2013 %u2013 %u2013 %u2013 %u2013 %u2013 %u2013 %u2013 %u2013 Public corporations and private enterprises %u2013 %u2013 %u2013 %u2013 %u2013 %u2013 %u2013 %u2013 %u2013 Non-profit institutions %u2013 %u2013 %u2013 %u2013 %u2013 %u2013 %u2013 %u2013 %u2013 Households 1 363 889 287 %u2013 423 423 %u2013 %u2013 %u2013 (100.0)Payments for capital assets %u2013 %u2013 %u2013 %u2013 %u2013 %u2013 %u2013 %u2013 %u2013 Buildings and other fixed structures %u2013 %u2013 %u2013 %u2013 %u2013 %u2013 %u2013 %u2013 %u2013 Machinery and equipment %u2013 %u2013 %u2013 %u2013 %u2013 %u2013 %u2013 %u2013 %u2013 Heritage Assets %u2013 %u2013 %u2013 %u2013 %u2013 %u2013 %u2013 %u2013 %u2013 Specialised military assets %u2013 %u2013 %u2013 %u2013 %u2013 %u2013 %u2013 %u2013 %u2013Biological assets %u2013 %u2013 %u2013 %u2013 %u2013 %u2013 %u2013 %u2013 %u2013Land and sub-soil assets %u2013 %u2013 %u2013 %u2013 %u2013 %u2013 %u2013 %u2013 %u2013Software and other intangible assets %u2013 %u2013 %u2013 %u2013 %u2013 %u2013 %u2013 %u2013 %u2013Payments for financial assets %u2013 %u2013 %u2013 %u2013 %u2013 %u2013 %u2013 %u2013 %u2013Total economic classification 47 636 50 281 50 883 63 738 57 433 57 433 68 765 74 451 77 836 19.72024/25Table 22 above shows the summary of payments and estimates per economic classification from 2021/22 to 2027/28. The expenditure increased from R47.636 million in 2021/22 to a revised estimate of R57.433 million in 2024/25 mainly due to the appointment of contractual personnel for municipal support interventions. In 2025/26, the budget increases by 19.7 per cent to R68.765 million mainly due to provisions made for new critical posts in the revised organisational structure. Compensation of Employees increased from R45.746 million in 2021/22 to a revised estimate of R53.932 million in 2024/25 due to the appointment of contractual personnel for municipal support interventions. In 2025/26, the budget increases by 22 per cent to R65.802 million due to provisions made for new critical posts in the revised organisational structure. Goods and Services increased from R1.001 million in 2021/22 to a revised estimate of R3.078 million in 2024/25 due to costs associated with the easing of COVID-19 restrictions. In 2025/26, the budget decreases by 3.7 per cent to R2.963 million due to internal reprioritisation. Transfers and Subsidies decreased from R889 thousand in 2021/22 to a revised estimate of R423 thousand in 2024/25 due to a decrease in the number of officials exiting the department. It is anticipated that no officials will be exiting the department, hence no further allocation over the 2025 MTEF. 796
