
Page 819 - Demo
P. 819
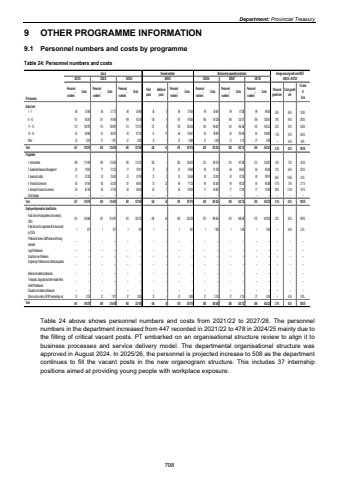
Department: Provincial Treasury 9 OTHER PROGRAMME INFORMATION 9.1 Personnel numbers and costs by programme Table 24: Personnel numbers and costs Actual Revised estimate Medium-term expenditure estimateR thousandsPersonnel numbers1 Costs Personnel numbers1 Costs Personnel numbers1 Costs Filled postsAdditional postsPersonnel numbers1 Costs Personnel numbers1 Costs Personnel numbers1 Costs Personnel numbers1 Costs Personnel growth rate Costs growth rate % Costs of Total Salary level1 %u2013 7 80 31 064 85 31 772 88 34 960 80 9 89 37 584 99 40 841 99 47 288 99 49 455 3.6% 9.6% 10.8%8 %u2013 10 157 92 341 151 91 648 149 92 158 153 4 157 97 685 166 116 226 166 122 511 166 128 041 1.9% 9.4% 28.0%11 %u2013 12 113 108 787 115 106 991 113 110 747 121 8 129 125 435 142 146 587 142 156 336 142 163 332 3.3% 9.2% 35.8%13 %u2013 16 63 84 585 61 84 057 63 87 153 51 15 66 93 481 64 96 870 64 103 440 64 108 095 -1.0% 5.0% 24.6%Other 34 2 501 27 1 971 37 2 832 37 %u2013 37 2 889 37 3 018 37 3 157 37 3 299 %u2013 4.5% 0.8%Total 447 319 278 439 316 439 450 327 850 442 36 478 357 074 508 403 542 508 432 732 508 452 222 2.0% 8.2% 100.0%Programme1. Administration 189 111 493 190 112 546 193 114 237 203 %u2013 203 124 603 213 139 214 213 147 288 213 153 921 1.6% 7.3% 34.3%2. Sustainable Resource Management 82 70 857 77 70 122 77 70 911 73 8 81 74 868 84 81 328 84 86 557 84 90 456 1.2% 6.5% 20.3%3. Asset and Liability 31 23 728 33 23 426 33 24 793 31 2 33 26 548 40 32 813 40 37 242 40 38 919 6.6% 13.6% 8.3%4. Financial Governance 80 67 454 80 63 329 87 69 405 73 23 96 77 123 94 84 385 94 90 321 94 94 388 -0.7% 7.0% 21.1%5. Municipal Financial Governance 65 45 746 59 47 016 60 48 504 62 3 65 53 932 77 65 802 77 71 324 77 74 538 5.8% 11.4% 16.1%Direct charges %u2013 %u2013 %u2013 %u2013 %u2013 %u2013 %u2013 %u2013 %u2013 %u2013 %u2013 %u2013 %u2013 %u2013 %u2013 %u2013 %u2013 %u2013 %u2013Total 447 319 278 439 316 439 450 327 850 442 36 478 357 074 508 403 542 508 432 732 508 452 222 2.0% 8.2% 100.0%Employee dispensation classificationPublic Service Act appointees not covered by OSDs 415 316 086 401 313 591 412 324 102 404 36 440 353 228 470 399 524 470 428 529 470 447 830 2.2% 8.2% 99.0%Public Service Act appointees still to be covered by OSDs 1 817 1 877 1 916 1 %u2013 1 957 1 1 000 1 1 046 1 1 093 %u2013 4.5% 0.2%Professional Nurses, Staff Nurses and Nursing Assistants %u2013 %u2013 %u2013 %u2013 %u2013 %u2013 %u2013 %u2013 %u2013 %u2013 %u2013 %u2013 %u2013 %u2013 %u2013 %u2013 %u2013 %u2013 %u2013Legal Professionals %u2013 %u2013 %u2013 %u2013 %u2013 %u2013 %u2013 %u2013 %u2013 %u2013 %u2013 %u2013 %u2013 %u2013 %u2013 %u2013 %u2013 %u2013 %u2013Social Services Professions %u2013 %u2013 %u2013 %u2013 %u2013 %u2013 %u2013 %u2013 %u2013 %u2013 %u2013 %u2013 %u2013 %u2013 %u2013 %u2013 %u2013 %u2013 %u2013Engineering Professions and related occupations %u2013 %u2013 %u2013 %u2013 %u2013 %u2013 %u2013 %u2013 %u2013 %u2013 %u2013 %u2013 %u2013 %u2013 %u2013 %u2013 %u2013 %u2013 %u2013Medical and related professionals %u2013 %u2013 %u2013 %u2013 %u2013 %u2013 %u2013 %u2013 %u2013 %u2013 %u2013 %u2013 %u2013 %u2013 %u2013 %u2013 %u2013 %u2013 %u2013Therapeutic, Diagnostic and other related Allied Health Professionals %u2013 %u2013 %u2013 %u2013 %u2013 %u2013 %u2013 %u2013 %u2013 %u2013 %u2013 %u2013 %u2013 %u2013 %u2013 %u2013 %u2013 %u2013 %u2013Educators and related professionals %u2013 %u2013 %u2013 %u2013 %u2013 %u2013 %u2013 %u2013 %u2013 %u2013 %u2013 %u2013 %u2013 %u2013 %u2013 %u2013 %u2013 %u2013 %u2013Others such as interns, EPWP, learnerships, etc 31 2 375 37 1 971 37 2 832 37 %u2013 37 2 889 37 3 018 37 3 157 37 3 299 %u2013 4.5% 0.8%Total 447 319 278 439 316 439 450 327 850 442 36 478 357 074 508 403 542 508 432 732 508 452 222 2.0% 8.2% 100.0% Average annual growth over MTEF 2021/22 2022/23 2023/24 2024/25 2025/26 2026/27 2027/28 2024/25 - 2027/28Table 24 above shows personnel numbers and costs from 2021/22 to 2027/28. The personnel numbers in the department increased from 447 recorded in 2021/22 to 478 in 2024/25 mainly due to the filling of critical vacant posts. PT embarked on an organisational structure review to align it to business processes and service delivery model. The departmental organisational structure was approved in August 2024. In 2025/26, the personnel is projected increase to 508 as the department continues to fill the vacant posts in the new organogram structure. This includes 37 internship positions aimed at providing young people with workplace exposure. 798
