
Page 823 - Demo
P. 823
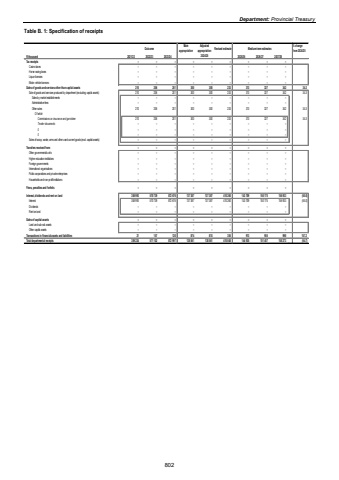
Department: Provincial Treasury Table B. 1: Specification of receipts Outcome Main appropriationAdjusted appropriation Revised estimate Medium-term estimates % change from 2024/25R thousand 2021/22 2022/23 2023/24 2025/26 2026/27 2027/28Tax receipts %u2013 %u2013 %u2013 %u2013 %u2013 %u2013 %u2013 %u2013 %u2013 Casino taxes %u2013 %u2013 %u2013 %u2013 %u2013 %u2013 %u2013 %u2013 %u2013 Horse racing taxes %u2013 %u2013 %u2013 %u2013 %u2013 %u2013 %u2013 %u2013 %u2013 Liquor licences %u2013 %u2013 %u2013 %u2013 %u2013 %u2013 %u2013 %u2013 %u2013 Motor vehicle licences %u2013 %u2013 %u2013 %u2013 %u2013 %u2013 %u2013 %u2013 %u2013 Sales of goods and services other than capital assets 210 206 201 300 300 233 313 327 342 34.3Sale of goods and services produced by department (excluding capital assets) 210 206 201 300 300 233 313 327 342 34.3Sales by market establishments %u2013 %u2013 %u2013 %u2013 %u2013 %u2013 %u2013 %u2013 %u2013 Administrative fees %u2013 %u2013 %u2013 %u2013 %u2013 %u2013 %u2013 %u2013 %u2013Other sales 210 206 201 300 300 233 313 327 342 34.3Of whichCommissions on insurance and garnishee 210 206 201 300 300 233 313 327 342 34.3Tender documents %u2013 %u2013 %u2013 %u2013 %u2013 %u2013 %u2013 %u2013 %u20130 %u2013 %u2013 %u2013 %u2013 %u2013 %u2013 %u2013 %u2013 %u20130 %u2013 %u2013 %u2013 %u2013 %u2013 %u2013 %u2013 %u2013 %u2013Sales of scrap, waste, arms and other used current goods (excl. capital assets) %u2013 %u2013 %u2013 %u2013 %u2013 %u2013 %u2013 %u2013 %u2013Transfers received from: %u2013 %u2013 %u2013 %u2013 %u2013 %u2013 %u2013 %u2013 %u2013Other governmental units %u2013 %u2013 %u2013 %u2013 %u2013 %u2013 %u2013 %u2013 %u2013Higher education institutions %u2013 %u2013 %u2013 %u2013 %u2013 %u2013 %u2013 %u2013 %u2013Foreign governments %u2013 %u2013 %u2013 %u2013 %u2013 %u2013 %u2013 %u2013 %u2013International organisations %u2013 %u2013 %u2013 %u2013 %u2013 %u2013 %u2013 %u2013 %u2013Public corporations and private enterprises %u2013 %u2013 %u2013 %u2013 %u2013 %u2013 %u2013 %u2013 %u2013Households and non-profit institutions %u2013 %u2013 %u2013 %u2013 %u2013 %u2013 %u2013 %u2013 %u2013Fines, penalties and forfeits %u2013 %u2013 %u2013 %u2013 %u2013 %u2013 %u2013 %u2013 %u2013Interest, dividends and rent on land 358 993 570 739 872 676 137 387 137 387 410 260 143 709 150 175 156 933 (65.0)Interest 358 993 570 739 872 676 137 387 137 387 410 260 143 709 150 175 156 933 (65.0)Dividends %u2013 %u2013 %u2013 %u2013 %u2013 %u2013 %u2013 %u2013 %u2013Rent on land %u2013 %u2013 %u2013 %u2013 %u2013 %u2013 %u2013 %u2013 %u2013Sales of capital assets %u2013 %u2013 %u2013 %u2013 %u2013 %u2013 %u2013 %u2013 %u2013Land and sub-soil assets %u2013 %u2013 %u2013 %u2013 %u2013 %u2013 %u2013 %u2013 %u2013Other capital assets %u2013 %u2013 %u2013 %u2013 %u2013 %u2013 %u2013 %u2013 %u2013Transactions in financial assets and liabilities 21 157 120 874 874 355 913 955 998 157.2Total departmental receipts 359 224 571 102 872 997 138 561 138 561 410 848 144 935 151 457 158 273 (64.7)2024/25802
