
Page 824 - Demo
P. 824
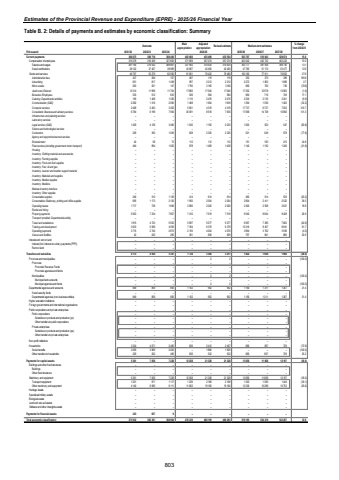
Estimates of the Provincial Revenue and Expenditure (EPRE) - 2025/26 Financial Year Table B. 2: Details of payments and estimates by economic classification: Summary Outcome Main appropriationAdjusted appropriation Revised estimate Medium-term estimates % change from 2024/25R thousand 2021/22 2022/23 2023/24 2025/26 2026/27 2027/28Current payments 369 718 366 075 388 406 463 660 435 496 435 554 503 707 510 643 529 074 15.6Compensation of employees 319 278 316 439 327 850 371 859 357 074 357 074 403 542 432 732 452 222 13.0Salaries and wages 281 156 279 032 288 861 327 992 314 624 314 624 355 777 381 558 398 745 13.1Social contributions 38 122 37 407 38 989 43 867 42 450 42 450 47 765 51 174 53 477 12.5Goods and services 46 797 53 279 60 556 91 801 78 422 78 480 100 165 77 911 76 852 27.6Administrative fees 284 427 157 487 119 119 352 370 389 195.8Advertising 817 651 1 438 997 2 212 2 212 2 272 1 802 1 885 2.7Minor assets 201 263 147 1 790 3 160 3 160 666 700 736 (78.9)Audit costs: External 11 999 13 314 11 754 17 882 17 540 17 540 17 252 12 978 13 565 (1.6)Bursaries: Employees 530 512 633 526 584 584 684 716 749 17.1Catering: Departmental activities 190 1 408 1 326 1 115 2 476 2 476 2 230 2 135 2 241 (9.9)Communication (G&S) 2 282 1 316 2 090 1 468 1 904 1 909 1 294 1 356 1 420 (32.2)Computer services 2 408 2 403 3 452 5 801 4 319 4 319 17 737 6 727 7 032 310.7Consultants: Business and advisory services 6 784 6 199 7 594 30 091 8 518 7 635 17 658 14 738 10 656 131.3Infrastructure and planning services %u2013 %u2013 %u2013 %u2013 %u2013 %u2013 %u2013 %u2013 %u2013Laboratory services %u2013 %u2013 %u2013 %u2013 %u2013 %u2013 %u2013 %u2013 %u2013Legal services (G&S) 1 429 4 126 3 490 1 545 1 150 2 033 1 000 523 547 (50.8)Science and technological services %u2013 %u2013 %u2013 %u2013 %u2013 %u2013 %u2013 %u2013 %u2013Contractors 229 350 1 036 628 2 325 2 325 521 549 578 (77.6)Agency and support/outsourced services %u2013 %u2013 %u2013 %u2013 %u2013 %u2013 %u2013 %u2013 %u2013Entertainment 40 58 73 112 112 112 151 183 215 34.8Fleet services (including government motor transport) 464 894 1 002 878 1 458 1 458 1 140 1 192 1 246 (21.8)Housing %u2013 %u2013 %u2013 %u2013 %u2013 %u2013 %u2013 %u2013 %u2013Inventory: Clothing material and accessories %u2013 %u2013 %u2013 %u2013 %u2013 %u2013 %u2013 %u2013 %u2013Inventory: Farming supplies %u2013 %u2013 %u2013 %u2013 %u2013 %u2013 %u2013 %u2013 %u2013Inventory: Food and food supplies %u2013 %u2013 %u2013 %u2013 %u2013 %u2013 %u2013 %u2013 %u2013Inventory: Fuel, oil and gas %u2013 %u2013 %u2013 %u2013 %u2013 %u2013 %u2013 %u2013 %u2013Inventory: Learner and teacher support material %u2013 %u2013 %u2013 %u2013 %u2013 %u2013 %u2013 %u2013 %u2013Inventory: Materials and supplies %u2013 %u2013 %u2013 %u2013 %u2013 %u2013 %u2013 %u2013 %u2013Inventory: Medical supplies %u2013 %u2013 %u2013 %u2013 %u2013 %u2013 %u2013 %u2013 %u2013Inventory: Medicine %u2013 %u2013 %u2013 %u2013 %u2013 %u2013 %u2013 %u2013 %u2013Medsas inventory interface %u2013 %u2013 %u2013 %u2013 %u2013 %u2013 %u2013 %u2013 %u2013Inventory: Other supplies %u2013 %u2013 %u2013 %u2013 %u2013 %u2013 %u2013 %u2013 %u2013Consumable supplies 246 310 1 129 414 614 614 490 514 539 (20.2)Consumables: Stationery, printing and office supplies 695 1 173 2 120 1 950 2 054 2 054 2 804 2 411 2 522 36.5Operating leases 1 717 738 1 849 2 880 2 020 2 020 2 400 2 508 2 621 18.8Rental and hiring %u2013 %u2013 %u2013 %u2013 %u2013 %u2013 %u2013 %u2013 %u2013Property payments 5 923 7 234 7 607 7 410 7 519 7 519 9 540 8 064 8 428 26.9Transport provided: Departmental activity %u2013 %u2013 %u2013 %u2013 %u2013 %u2013 %u2013 %u2013 %u2013Travel and subsistence 1 815 4 723 5 932 5 897 9 277 9 277 6 967 7 385 7 820 (24.9)Training and development 3 633 5 569 4 559 7 394 6 379 6 379 10 316 8 457 8 841 61.7Operating payments 3 715 2 740 2 873 2 155 4 024 4 076 3 894 3 762 3 936 (4.5)Venues and facilities 42 225 295 381 658 659 797 841 886 20.9Interest and rent on land %u2013 %u2013 %u2013 %u2013 %u2013 %u2013 %u2013 %u2013 %u2013Interest (Incl. interest on unitary payments (PPP)) %u2013 %u2013 %u2013 %u2013 %u2013 %u2013 %u2013 %u2013 %u2013Rent on land %u2013 %u2013 %u2013 %u2013 %u2013 %u2013 %u2013 %u2013 %u2013Transfers and subsidies 4 173 4 930 3 341 1 738 3 366 3 411 1 822 1 908 1 996 (46.6)Provinces and municipalities %u2013 %u2013 %u2013 %u2013 2 2 %u2013 %u2013 %u2013 (100.0)Provinces %u2013 %u2013 %u2013 %u2013 %u2013 %u2013 %u2013 %u2013 %u2013Provincial Revenue Funds %u2013 %u2013 %u2013 %u2013 %u2013 %u2013 %u2013 %u2013 %u2013Provincial agencies and funds %u2013 %u2013 %u2013 %u2013 %u2013 %u2013 %u2013 %u2013 %u2013Municipalities %u2013 %u2013 %u2013 %u2013 2 2 %u2013 %u2013 %u2013 (100.0)Municipal bank accounts %u2013 %u2013 %u2013 %u2013 %u2013 %u2013 %u2013 %u2013 %u2013Municipal agencies and funds %u2013 %u2013 %u2013 %u2013 2 2 %u2013 %u2013 %u2013 (100.0)Departmental agencies and accounts 849 859 856 1 102 952 952 1 156 1 211 1 267 21.4Social security funds %u2013 %u2013 %u2013 %u2013 %u2013 %u2013 %u2013 %u2013 %u2013Departmental agencies (non-business entities) 849 859 856 1 102 952 952 1 156 1 211 1 267 21.4Higher education institutions %u2013 %u2013 %u2013 %u2013 %u2013 %u2013 %u2013 %u2013 %u2013Foreign governments and international organisations %u2013 %u2013 %u2013 %u2013 %u2013 %u2013 %u2013 %u2013 %u2013Public corporations and private enterprises %u2013 %u2013 %u2013 %u2013 %u2013 %u2013 %u2013 %u2013 %u2013Public corporations %u2013 %u2013 %u2013 %u2013 %u2013 %u2013 %u2013 %u2013 %u2013Subsidies on products and production (pc) %u2013 %u2013 %u2013 %u2013 %u2013 %u2013 %u2013 %u2013 %u2013Other transfers to public corporations %u2013 %u2013 %u2013 %u2013 %u2013 %u2013 %u2013 %u2013 %u2013Private enterprises %u2013 %u2013 %u2013 %u2013 %u2013 %u2013 %u2013 %u2013 %u2013Subsidies on products and production (pe) %u2013 %u2013 %u2013 %u2013 %u2013 %u2013 %u2013 %u2013 %u2013Other transfers to private enterprises %u2013 %u2013 %u2013 %u2013 %u2013 %u2013 %u2013 %u2013 %u2013Non-profit institutions %u2013 %u2013 %u2013 %u2013 %u2013 %u2013 %u2013 %u2013 %u2013Households 3 324 4 071 2 485 636 2 412 2 457 666 697 729 (72.9)Social benefits 3 095 3 869 2 000 %u2013 1 880 1 925 %u2013 %u2013 %u2013 (100.0)Other transfers to households 229 202 485 636 532 532 666 697 729 25.2Payments for capital assets 5 361 7 056 7 228 12 838 21 328 21 328 13 656 11 668 12 197 (36.0)Buildings and other fixed structures %u2013 %u2013 %u2013 %u2013 %u2013 %u2013 %u2013 %u2013 %u2013Buildings %u2013 %u2013 %u2013 %u2013 %u2013 %u2013 %u2013 %u2013 %u2013Other fixed structures %u2013 %u2013 %u2013 %u2013 %u2013 %u2013 %u2013 %u2013 %u2013Machinery and equipment 5 361 7 056 7 228 12 838 21 328 21 328 13 656 11 668 12 197 (36.0)Transport equipment 1 221 971 1 117 1 236 2 168 2 168 1 320 1 380 1 444 (39.1)Other machinery and equipment 4 140 6 085 6 111 11 602 19 160 19 160 12 336 10 288 10 753 (35.6)Heritage Assets %u2013 %u2013 %u2013 %u2013 %u2013 %u2013 %u2013 %u2013 %u2013Specialised military assets %u2013 %u2013 %u2013 %u2013 %u2013 %u2013 %u2013 %u2013 %u2013Biological assets %u2013 %u2013 %u2013 %u2013 %u2013 %u2013 %u2013 %u2013 %u2013Land and sub-soil assets %u2013 %u2013 %u2013 %u2013 %u2013 %u2013 %u2013 %u2013 %u2013Software and other intangible assets %u2013 %u2013 %u2013 %u2013 %u2013 %u2013 %u2013 %u2013 %u2013Payments for financial assets 323 657 9 %u2013 %u2013 %u2013 %u2013 %u2013 %u2013Total economic classification 375 932 382 361 398 984 478 236 460 190 460 293 519 185 524 219 543 267 12.82024/25803
