
Page 825 - Demo
P. 825
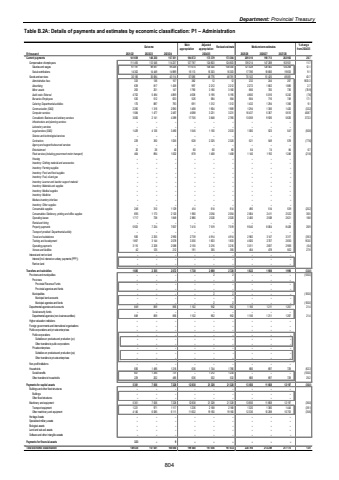
Department: Provincial Treasury Table B.2A: Details of payments and estimates by economic classification: P1 %u2013 Administration Outcome Main appropriationAdjusted appropriation Revised estimate Medium-term estimates % change from 2024/25R thousand 2021/22 2022/23 2023/24 2025/26 2026/27 2027/28Current payments 141 659 148 230 157 351 184 872 173 379 173 384 209 316 198 713 202 982 20.7Compensation of employees 111 493 112 546 114 237 127 787 124 603 124 603 139 214 147 288 153 921 11.7Salaries and wages 97 191 98 097 99 248 111 674 108 300 108 300 121 428 128 482 134 268 12.1Social contributions 14 302 14 449 14 989 16 113 16 303 16 303 17 786 18 806 19 653 9.1Goods and services 30 166 35 684 43 114 57 085 48 776 48 781 70 102 51 425 49 061 43.7Administrative fees 333 136 157 382 12 12 232 244 257 1833.3Advertising 639 817 1 438 997 2 212 2 212 2 272 1 802 1 885 2.7Minor assets 263 201 147 1 790 3 160 3 160 666 700 736 (78.9)Audit costs: External 4 702 5 494 4 859 4 638 5 195 5 195 4 800 5 016 5 242 (7.6)Bursaries: Employees 530 512 633 526 584 584 684 716 749 17.1Catering: Departmental activities 170 887 793 691 1 312 1 312 1 432 1 294 1 356 9.1Communication (G&S) 2 282 1 316 2 090 1 468 1 904 1 909 1 294 1 356 1 420 (32.2)Computer services 1 584 1 477 2 467 4 688 3 231 3 231 16 437 5 367 5 610 408.7Consultants: Business and advisory services 3 000 2 141 4 389 17 705 3 648 2 765 13 059 9 926 5 626 372.3Infrastructure and planning services %u2013 %u2013 %u2013 %u2013 %u2013 %u2013 %u2013 %u2013 %u2013Laboratory services %u2013 %u2013 %u2013 %u2013 %u2013 %u2013 %u2013 %u2013 %u2013Legal services (G&S) 1 429 4 126 3 490 1 545 1 150 2 033 1 000 523 547 (50.8)Science and technological services %u2013 %u2013 %u2013 %u2013 %u2013 %u2013 %u2013 %u2013 %u2013Contractors 229 350 1 036 628 2 325 2 325 521 549 578 (77.6)Agency and support/outsourced services %u2013 %u2013 %u2013 %u2013 %u2013 %u2013 %u2013 %u2013 %u2013Entertainment 20 26 40 60 60 60 64 74 84 6.7Fleet services (including government motor transport) 464 894 1 002 878 1 458 1 458 1 140 1 192 1 246 (21.8)Housing %u2013 %u2013 %u2013 %u2013 %u2013 %u2013 %u2013 %u2013 %u2013Inventory: Clothing material and accessories %u2013 %u2013 %u2013 %u2013 %u2013 %u2013 %u2013 %u2013 %u2013Inventory: Farming supplies %u2013 %u2013 %u2013 %u2013 %u2013 %u2013 %u2013 %u2013 %u2013Inventory: Food and food supplies %u2013 %u2013 %u2013 %u2013 %u2013 %u2013 %u2013 %u2013 %u2013Inventory: Fuel, oil and gas %u2013 %u2013 %u2013 %u2013 %u2013 %u2013 %u2013 %u2013 %u2013Inventory: Learner and teacher support material %u2013 %u2013 %u2013 %u2013 %u2013 %u2013 %u2013 %u2013 %u2013Inventory: Materials and supplies %u2013 %u2013 %u2013 %u2013 %u2013 %u2013 %u2013 %u2013 %u2013Inventory: Medical supplies %u2013 %u2013 %u2013 %u2013 %u2013 %u2013 %u2013 %u2013 %u2013Inventory: Medicine %u2013 %u2013 %u2013 %u2013 %u2013 %u2013 %u2013 %u2013 %u2013Medsas inventory interface %u2013 %u2013 %u2013 %u2013 %u2013 %u2013 %u2013 %u2013 %u2013Inventory: Other supplies %u2013 %u2013 %u2013 %u2013 %u2013 %u2013 %u2013 %u2013 %u2013Consumable supplies 246 310 1 129 414 614 614 490 514 539 (20.2)Consumables: Stationery, printing and office supplies 695 1 173 2 120 1 950 2 054 2 054 2 804 2 411 2 522 36.5Operating leases 1 717 738 1 849 2 880 2 020 2 020 2 400 2 508 2 621 18.8Rental and hiring %u2013 %u2013 %u2013 %u2013 %u2013 %u2013 %u2013 %u2013 %u2013Property payments 5 923 7 234 7 607 7 410 7 519 7 519 9 540 8 064 8 428 26.9Transport provided: Departmental activity %u2013 %u2013 %u2013 %u2013 %u2013 %u2013 %u2013 %u2013 %u2013Travel and subsistence 926 2 255 2 990 2 739 4 914 4 914 2 982 3 147 3 317 (39.3)Training and development 1 857 3 144 2 078 3 350 1 833 1 833 4 820 2 707 2 830 163.0Operating payments 3 115 2 328 2 588 2 155 3 216 3 216 3 011 2 837 2 966 (6.4)Venues and facilities 42 125 212 191 355 355 454 478 502 27.9Interest and rent on land %u2013 %u2013 %u2013 %u2013 %u2013 %u2013 %u2013 %u2013 %u2013Interest (Incl. interest on unitary payments (PPP)) %u2013 %u2013 %u2013 %u2013 %u2013 %u2013 %u2013 %u2013 %u2013Rent on land %u2013 %u2013 %u2013 %u2013 %u2013 %u2013 %u2013 %u2013 %u2013Transfers and subsidies 1 685 2 355 2 072 1 738 2 698 2 720 1 822 1 908 1 996 (33.0)Provinces and municipalities %u2013 %u2013 %u2013 %u2013 2 2 %u2013 %u2013 %u2013 (100.0)Provinces %u2013 %u2013 %u2013 %u2013 %u2013 %u2013 %u2013 %u2013 %u2013Provincial Revenue Funds %u2013 %u2013 %u2013 %u2013 %u2013 %u2013 %u2013 %u2013 %u2013Provincial agencies and funds %u2013 %u2013 %u2013 %u2013 %u2013 %u2013 %u2013 %u2013 %u2013Municipalities %u2013 %u2013 %u2013 %u2013 2 2 %u2013 %u2013 %u2013 (100.0)Municipal bank accounts %u2013 %u2013 %u2013 %u2013 %u2013 %u2013 %u2013 %u2013 %u2013Municipal agencies and funds %u2013 %u2013 %u2013 %u2013 2 2 %u2013 %u2013 %u2013 (100.0)Departmental agencies and accounts 849 859 856 1 102 952 952 1 156 1 211 1 267 21.4Social security funds %u2013 %u2013 %u2013 %u2013 %u2013 %u2013 %u2013 %u2013 %u2013Departmental agencies (non-business entities) 849 859 856 1 102 952 952 1 156 1 211 1 267 21.4Higher education institutions %u2013 %u2013 %u2013 %u2013 %u2013 %u2013 %u2013 %u2013 %u2013Foreign governments and international organisations %u2013 %u2013 %u2013 %u2013 %u2013 %u2013 %u2013 %u2013 %u2013Public corporations and private enterprises %u2013 %u2013 %u2013 %u2013 %u2013 %u2013 %u2013 %u2013 %u2013Public corporations %u2013 %u2013 %u2013 %u2013 %u2013 %u2013 %u2013 %u2013 %u2013Subsidies on products and production (pc) %u2013 %u2013 %u2013 %u2013 %u2013 %u2013 %u2013 %u2013 %u2013Other transfers to public corporations %u2013 %u2013 %u2013 %u2013 %u2013 %u2013 %u2013 %u2013 %u2013Private enterprises %u2013 %u2013 %u2013 %u2013 %u2013 %u2013 %u2013 %u2013 %u2013Subsidies on products and production (pe) %u2013 %u2013 %u2013 %u2013 %u2013 %u2013 %u2013 %u2013 %u2013Other transfers to private enterprises %u2013 %u2013 %u2013 %u2013 %u2013 %u2013 %u2013 %u2013 %u2013Non-profit institutions %u2013 %u2013 %u2013 %u2013 %u2013 %u2013 %u2013 %u2013 %u2013Households 836 1 496 1 216 636 1 744 1 766 666 697 729 (62.3)Social benefits 607 1 294 731 %u2013 1 212 1 234 %u2013 %u2013 %u2013 (100.0)Other transfers to households 229 202 485 636 532 532 666 697 729 25.2Payments for capital assets 5 361 7 056 7 228 12 838 21 328 21 328 13 656 11 668 12 197 (36.0)Buildings and other fixed structures %u2013 %u2013 %u2013 %u2013 %u2013 %u2013 %u2013 %u2013 %u2013Buildings %u2013 %u2013 %u2013 %u2013 %u2013 %u2013 %u2013 %u2013 %u2013Other fixed structures %u2013 %u2013 %u2013 %u2013 %u2013 %u2013 %u2013 %u2013 %u2013Machinery and equipment 5 361 7 056 7 228 12 838 21 328 21 328 13 656 11 668 12 197 (36.0)Transport equipment 1 221 971 1 117 1 236 2 168 2 168 1 320 1 380 1 444 (39.1)Other machinery and equipment 4 140 6 085 6 111 11 602 19 160 19 160 12 336 10 288 10 753 (35.6)Heritage Assets %u2013 %u2013 %u2013 %u2013 %u2013 %u2013 %u2013 %u2013 %u2013Specialised military assets %u2013 %u2013 %u2013 %u2013 %u2013 %u2013 %u2013 %u2013 %u2013Biological assets %u2013 %u2013 %u2013 %u2013 %u2013 %u2013 %u2013 %u2013 %u2013Land and sub-soil assets %u2013 %u2013 %u2013 %u2013 %u2013 %u2013 %u2013 %u2013 %u2013Software and other intangible assets %u2013 %u2013 %u2013 %u2013 %u2013 %u2013 %u2013 %u2013 %u2013Payments for financial assets 323 %u2013 9 %u2013 %u2013 %u2013 %u2013 %u2013 %u2013Total economic classification 149 028 157 641 166 660 199 448 197 405 197 432 224 794 212 289 217 175 13.92024/25804
