Page 464 - Provincial Treasury Estimates.pdf
P. 464

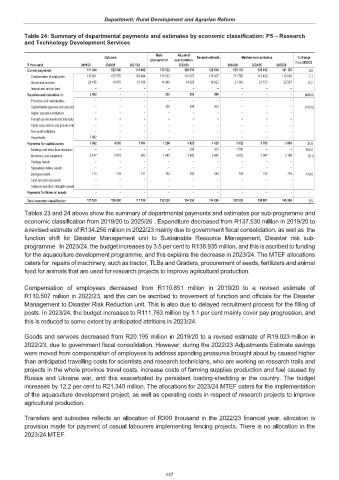
Department: Rural Development and Agrarian Reform

           Table 24: Summary of departmental payments and estimates by economic classification: P5 – Research
           and Technology Development Services

                                                          Main   Adjusted
                                       Outcome                          Revised estimate  Medium-term estimates  % change
                                                       appropriation  appropriation
            R thousand         2019/20  2020/21  2021/22         2022/23           2023/24  2024/25  2025/26  from 2022/23
            Current payments                  131 046                  122 540                  116 692                  130 522                  129 530                  129 530                  133 103                  135 012                  141 135  2.8
              Compensation of employees                   110 851                  107 570                  103 494                  115 532                  110 507                  110 507                  111 763                  113 439                  118 568  1.1
              Goods and services                     20 195                    14 970                    13 198                    14 990                    19 023                    19 023                    21 340                    21 573                    22 567  12.2
              Interest and rent on land                              –                             –                             –                             –                             –                             –                             –                             –                             –
            Transfers and subsidies to:                      2 492                             –                             –                         300                         300                         300                             –                             –                             –  (100.0)
              Provinces and municipalities                              –                             –                             –                             –                             –                             –                             –                             –                             –
              Departmental agencies and accounts                            –                             –                             –                         300                         300                         300                             –                             –                             –  (100.0)
              Higher education institutions                             –                             –                             –                             –                             –                             –                             –                             –                             –
              Foreign governments and internation                            –                             –                             –                             –                             –                             –                             –                             –                             –
              Public corporations and private ente                            –                             –                             –                             –                             –                             –                             –                             –                             –
              Non-profit institutions                             –                             –                             –                             –                             –                             –                             –                             –                             –
              Households                         2 492                             –                             –                             –                             –                             –                             –                             –                             –
            Payments for capital assets                      3 992                      4 060                      1 104                      1 206                      4 426                      4 426                      5 832                      3 789                      3 963  31.8
              Buildings and other fixed structures                            –                             –                             –                             –                         200                         200                      1 500                             –                             –  650.0
              Machinery and equipment                      3 877                      3 918                         963                      1 042                      3 942                      3 942                      3 623                      3 047                      3 188  (8.1)
              Heritage Assets                             –                             –                             –                             –                             –                             –                             –                             –                             –
              Specialised military assets                             –                             –                             –                             –                             –                             –                             –                             –                             –
              Biological assets                         115                         142                         141                         164                         284                         284                         709                         742                         775  149.6
              Land and sub-soil assets                             –                             –                             –                             –                             –                             –                             –                             –                             –
              Software and other intangible assets                            –                             –                             –                             –                             –                             –                             –                             –                             –
            Payments for financial assets                             –                             –                             –                             –                             –                             –                             –                             –                             –
            Total economic classification                  137 530                  126 600                  117 796                  132 028                  134 256                  134 256                  138 935                  138 801                  145 098  3.5

           Tables 23 and 24 above show the summary of departmental payments and estimates per sub-programme and
           economic classification from 2019/20 to 2025/26 . Expenditure decreased from R137.530 million in 2019/20 to
           a revised estimate of R134.256 million in 2022/23 mainly due to government fiscal consolidation, as well as  the
           function shift for  Disaster Management  unit to Sustainable  Resource  Management,  Disaster  risk  sub-
           programme.  In 2023/24, the budget increases by 3.5 per cent to R138.935 million, and this is ascribed to funding
           for the aquaculture development programme, and this explains the decrease in 2023/24. The MTEF allocations
           caters for  repairs of machinery, such as tractor, TLBs and Graders, procurement of seeds, fertilizers and animal
           feed for animals that are used for research projects to improve agricultural production.

           Compensation  of  employees  decreased  from  R110.851  million  in  2019/20  to  a  revised  estimate  of
           R110.507 million in 2022/23, and this can be ascribed to movement of function and officials for the Disaster
           Management to Disaster Risk Reduction unit. This is also due to delayed recruitment process for the filling of
           posts. In 2023/24, the budget increases to R111.763 million by 1.1 per cent mainly cover pay progression, and
           this is reduced to some extent by anticipated attritions in 2023/24.

           Goods and services decreased from R20.195 million in 2019/20 to a revised estimate of R19.023 million in
           2022/23, due to government fiscal consolidation. However, during the 2022/23 Adjustments Estimate savings
           were moved from compensation of employees to address spending pressures brought about by caused higher
           than anticipated travelling costs for scientists and research technicians, who are working on research trails and
           projects in the whole province travel costs, increase costs of farming supplies production and fuel caused by
           Russia and Ukraine war, and this exacerbated by persistent loading-shedding in the country. The budget
           increases by 12.2 per cent to R21.340 million. The allocations for 2023/24 MTEF caters for the implementation
           of the aquaculture development project, as well as operating costs in respect of research projects to improve
           agricultural production.

           Transfers and subsidies reflects an allocation of R300 thousand in the 2022/23 financial year, allocation is
           provision made for payment of casual labourers implementing fencing projects. There is no allocation in the
           2023/24 MTEF.


                                                             447
   459   460   461   462   463   464   465   466   467   468   469