
Page 468 - Provincial Treasury Estimates.pdf
P. 468
Department: Rural Development and Agrarian Reform
Table 29: Summary of of departmental payments and estimates by economic classification: P7 –
Agricultural Education and Training
Main Adjusted
Outcome Revised estimate Medium-term estimates % change
appropriation appropriation from 2022/23
R thousand 2019/20 2020/21 2021/22 2022/23 2023/24 2024/25 2025/26
Current payments 93 628 87 492 104 769 105 872 114 257 114 257 111 674 115 593 122 840 (2.3)
Compensation of employees 67 674 73 363 81 342 82 370 84 994 84 994 87 453 88 765 92 847 2.9
Goods and services 25 954 13 630 23 427 23 502 29 263 29 263 24 221 26 828 29 993 (17.2)
Interest and rent on land – 499 – – – – – – –
Transfers and subsidies to: 58 704 60 896 63 427 59 051 59 051 59 051 61 708 64 479 67 445 4.5
Provinces and municipalities – – – – – – – – –
Departmental agencies and accounts – – – – – – – – –
Higher education institutions 58 704 59 801 61 198 59 051 59 051 59 051 61 708 64 479 67 445 4.5
Foreign governments and internation – – – – – – – – –
Public corporations and private ente – – – – – – – – –
Non-profit institutions – – – – – – – – –
Households – 1 095 2 229 – – – – – –
Payments for capital assets 16 450 16 262 16 949 20 082 19 282 19 282 20 805 21 888 20 868 7.9
Buildings and other fixed structures 7 533 10 712 15 498 19 270 18 270 18 270 19 943 20 838 19 772 9.2
Machinery and equipment 8 917 5 550 1 451 812 1 012 1 012 862 1 050 1 096 (14.8)
Heritage Assets – – – – – – – – –
Specialised military assets – – – – – – – – –
Biological assets – – – – – – – – –
Land and sub-soil assets – – – – – – – – –
Software and other intangible assets – – – – – – – – –
Payments for financial assets – – – – – – – – –
Total economic classification 168 782 164 650 185 145 185 005 192 590 192 590 194 187 201 960 211 153 0.8
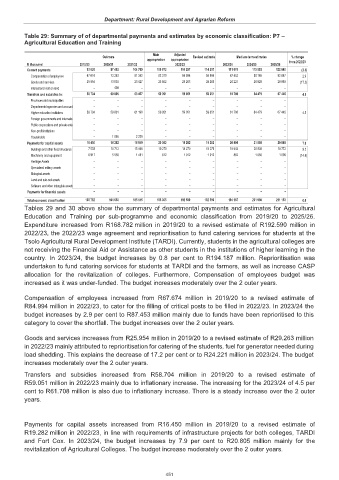
Tables 29 and 30 above show the summary of departmental payments and estimates for Agricultural
Education and Training per sub-programme and economic classification from 2019/20 to 2025/26.
Expenditure increased from R168.782 million in 2019/20 to a revised estimate of R192.590 million in
2022/23, the 2022/23 wage agreement and reprioritisation to fund catering services for students at the
Tsolo Agricultural Rural Development Institute (TARDI). Currently, students in the agricultural colleges are
not receiving the Financial Aid or Assistance as other students in the institutions of higher learning in the
country. In 2023/24, the budget increases by 0.8 per cent to R194.187 million. Reprioritisation was
undertaken to fund catering services for students at TARDI and the farmers, as well as increase CASP
allocation for the revitalization of colleges. Furthermore, Compensation of employees budget was
increased as it was under-funded. The budget increases moderately over the 2 outer years.
Compensation of employees increased from R67.674 million in 2019/20 to a revised estimate of
R84.994 million in 2022/23, to cater for the filling of critical posts to be filled in 2022/23. In 2023/24 the
budget increases by 2.9 per cent to R87.453 million mainly due to funds have been reprioritised to this
category to cover the shortfall. The budget increases over the 2 outer years.
Goods and services increases from R25.954 million in 2019/20 to a revised estimate of R29.263 million
in 2022/23 mainly attributed to reprioritisation for catering of the students, fuel for generator needed during
load shedding. This explains the decrease of 17.2 per cent or to R24.221 million in 2023/24. The budget
increases moderately over the 2 outer years.
Transfers and subsidies increased from R58.704 million in 2019/20 to a revised estimate of
R59.051 million in 2022/23 mainly due to inflationary increase. The increasing for the 2023/24 of 4.5 per
cent to R61.708 million is also due to inflationary increase. There is a steady increase over the 2 outer
years.
Payments for capital assets increased from R16.450 million in 2019/20 to a revised estimate of
R19.282 million in 2022/23, in line with requirements of infrastructure projects for both colleges, TARDI
and Fort Cox. In 2023/24, the budget increases by 7.9 per cent to R20.805 million mainly for the
revitalization of Agricultural Colleges. The budget increase moderately over the 2 outer years.
451