Page 466 - Provincial Treasury Estimates.pdf
P. 466

Department: Rural Development and Agrarian Reform


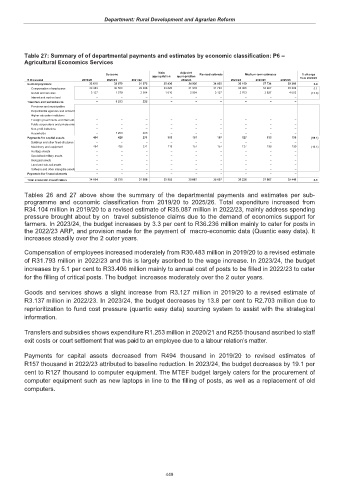
           Table 27: Summary of of departmental payments and estimates by economic classification: P6 –
           Agricultural Economics Services

                                                          Main    Adjusted
                                        Outcome                          Revised estimate  Medium-term estimates  % change
                                                        appropriation  appropriation                        from 2022/23
            R thousand         2019/20  2020/21  2021/22          2022/23           2023/24  2024/25  2025/26
            Current payments                    33 610                    32 079                    31 372                    35 436                    34 930                    34 930                    36 109                    37 734                    39 309  3.4
              Compensation of employees                     30 483                    30 500                    29 368                    33 826                    31 976                    31 793                    33 406                    33 907                    35 306  5.1
              Goods and services                       3 127                      1 579                      2 004                      1 610                      2 954                      3 137                      2 703                      3 827                      4 003  (13.8)
              Interest and rent on land                              –                             –                             –                             –                             –                             –                             –                             –                             –
            Transfers and subsidies to:                             –                      1 253                         225                             –                             –                             –                             –                             –                             –
              Provinces and municipalities                              –                             –                             –                             –                             –                             –                             –                             –                             –
              Departmental agencies and accounts                            –                            –                               –                             –                             –                             –                             –                             –                             –
              Higher education institutions                             –                             –                             –                             –                             –                             –                             –                             –                             –
              Foreign governments and internation                            –                            –                               –                             –                             –                             –                             –                             –                             –
              Public corporations and private ente                            –                              –                             –                             –                             –                             –                             –                             –                             –
              Non-profit institutions                             –                             –                             –                             –                             –                             –                             –                             –                             –
              Households                                 –                      1 253                         225                             –                             –                             –                             –                             –                             –
            Payments for capital assets                         494                         426                         271                         119                         157                         157                         127                         133                         139  (19.1)
              Buildings and other fixed structures                             –                             –                             –                             –                             –                             –                             –                             –                             –
              Machinery and equipment                         494                         426                         271                         119                         157                         157                         127                         133                         139  (19.1)
              Heritage Assets                             –                             –                             –                             –                             –                             –                             –                             –                             –
              Specialised military assets                             –                             –                             –                             –                             –                             –                             –                             –                             –
              Biological assets                             –                             –                             –                             –                             –                             –                             –                             –                             –
              Land and sub-soil assets                             –                             –                             –                             –                             –                             –                             –                             –                             –
              Software and other intangible assets                            –                             –                             –                             –                             –                             –                             –                             –                             –
            Payments for financial assets                             –                             –                             –                             –                             –                             –                             –                             –                             –
            Total economic classification                    34 104                    33 758                    31 868                    35 555                    35 087                    35 087                    36 236                    37 867                    39 448  3.3


           Tables 26 and 27 above show the  summary of the  departmental payments and estimates per sub-
           programme and economic classification  from  2019/20  to 2025/26. Total expenditure increased from
           R34.104 million in 2019/20 to a revised estimate of R35.087 million in 2022/23, mainly address spending
           pressure brought about by on  travel subsistence claims due to the demand of economics support for
           farmers. In 2023/24, the budget increases by 3.3 per cent to R36.236 million mainly to cater for posts in
           the 2022/23 ARP, and provision made for the payment of  macro-economic data (Quantic easy data). It
           increases steadily over the 2 outer years.


           Compensation of employees increased moderately from R30.483 million in 2019/20 to a revised estimate
           of R31.793 million in 2022/23 and this is largely ascribed to the wage increase. In 2023/24, the budget
           increases by 5.1 per cent to R33.406 million mainly to annual cost of posts to be filled in 2022/23 to cater
           for the filling of critical posts. The budget  increases moderately over the 2 outer years.

           Goods and services shows a slight increase from R3.127 million in 2019/20 to a revised estimate of
           R3.137 million in 2022/23. In 2023/24, the budget decreases by 13.8 per cent to R2.703 million due to
           reprioritization to fund cost pressure (quantic easy data) sourcing system to assist with the strategical
           information.

           Transfers and subsidies shows expenditure R1.253 million in 2020/21 and R255 thousand ascribed to staff
           exit costs or court settlement that was paid to an employee due to a labour relation’s matter.

           Payments for  capital  assets  decreased from R494  thousand  in 2019/20 to  revised  estimates  of
           R157 thousand in 2022/23 attributed to baseline reduction. In 2023/24, the budget decreases by 19.1 per
           cent to R127 thousand to computer equipment. The MTEF budget largely caters for the procurement of
           computer equipment such as new laptops in line to the filling of posts, as well as a replacement of old
           computers.


                                                             449
   461   462   463   464   465   466   467   468   469   470   471