
Page 471 - Provincial Treasury Estimates.pdf
P. 471
Estimates of the Provincial Revenue and Expenditure (EPRE) – 2023/24 Financial Year
R2.065 million, mainly cater for the continuation of the Rural Market centres’ initiative, procurement and
replacement of computer equipment such as laptops.
8.8.1 Service Delivery Measures
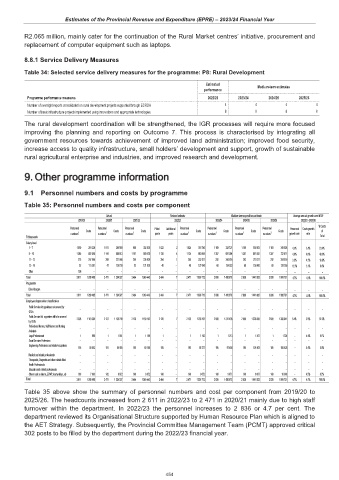
Table 34: Selected service delivery measures for the programme: P8: Rural Development
Estimated Medium-term estimates
performance
Programme performance measures 2022/23 2023/24 2024/25 2025/26
Number of oversight reports consolidated on rural development projects supported through ECRDA 4 4 4 4
Number of basic infrastructure projects implemented using innovations and appropriate technologies. 8 8 8 8
The rural development coordination will be strengthened, the IGR processes will require more focused
improving the planning and reporting on Outcome 7. This process is characterised by integrating all
government resources towards achievement of improved land administration; improved food security,
increase access to quality infrastructure, small holders’ development and support, growth of sustainable
rural agricultural enterprise and industries, and improved research and development.
9. 9. Other programme information
9.1 Personnel numbers and costs by programme
Table 35: Personnel numbers and costs per component
Actual Revised estimate Medium-term expenditure estimate Average annual growth over MTEF
2019/20 2020/21 2021/22 2022/23 2023/24 2024/25 2025/26 2022/23 - 2025/26
% Costs
Personnel Costs Personnel Costs Personnel Costs Filled Additional Personnel Costs Personnel Costs Personnel Costs Personnel Costs Personnel Costs growth of
numbers 1 numbers 1 numbers 1 posts posts numbers 1 numbers 1 numbers 1 numbers 1 growth rate rate
R thousands Total
Salary level
1 – 7 1 090 218 228 1 011 294 589 988 302 038 1 022 2 1 024 316 746 1 169 328 721 1 169 336 963 1 169 349 928 4.5% 3.4% 23.4%
8 – 10 1 085 692 840 1 144 586 513 1 157 589 428 1 130 4 1 134 640 855 1 307 691 004 1 307 697 892 1 307 732 571 4.8% 4.6% 48.3%
11 – 12 278 247 046 269 227 066 266 236 939 264 1 265 252 071 292 266 816 292 270 227 292 284 876 3.3% 4.2% 18.8%
13 – 16 52 111 381 47 126 159 53 121 038 48 – 48 127 040 68 134 033 68 136 800 68 139 356 12.3% 3.1% 9.4%
Other 106 – – – – – – – – – – – – – – – – – –
Total 2 611 1 269 495 2 471 1 234 327 2 464 1 249 443 2 464 7 2 471 1 336 712 2 836 1 420 573 2 836 1 441 882 2 836 1 506 731 4.7% 4.1% 100.0%
Programme
Direct charges – – – – – – – – – – – – – – – – – – –
Total 2 611 1 269 495 2 471 1 234 327 2 464 1 249 443 2 464 7 2 471 1 336 712 2 836 1 420 573 2 836 1 441 882 2 836 1 506 731 4.7% 4.1% 100.0%
Employee dispensation classification
Public Service Act appointees not covered by – – – – – – – – – – – – – – – – – – –
OSDs
Public Service Act appointees still to be covered 2 306 1 181 384 2 137 1 139 749 2 128 1 150 162 2 128 7 2 135 1 238 101 2 500 1 312 403 2 500 1 328 855 2 500 1 388 641 5.4% 3.9% 92.3%
by OSDs
Professional Nurses, Staff Nurses and Nursing – – – – – – – – – – – – – – – – – – –
Assistants
Legal Professionals 1 996 1 1 051 1 1 109 1 – 1 1 162 1 1 213 1 1 267 1 1 324 – 4.4% 0.1%
Social Services Professions – – – – – – – – – – – – – – – – – – –
Engineering Professions and related occupations
195 80 052 191 84 455 195 89 100 195 – 195 88 377 195 97 486 195 101 863 195 106 426 – 6.4% 6.9%
Medical and related professionals – – – – – – – – – – – – – – – – – – –
Therapeutic, Diagnostic and other related Allied – – – – – – – – – – – – – – – – – – –
Health Professionals
Educators and related professionals – – – – – – – – – – – – – – – – – – –
Others such as interns, EPWP, learnerships, etc 109 7 063 142 9 072 140 9 072 140 – 140 9 072 140 9 471 140 9 897 140 10 340 – 4.5% 0.7%
Total 2 611 1 269 495 2 471 1 234 327 2 464 1 249 443 2 464 7 2 471 1 336 712 2 836 1 420 573 2 836 1 441 882 2 836 1 506 731 4.7% 4.1% 100.0%
Table 35 above show the summary of personnel numbers and cost per component from 2019/20 to
2025/26. The headcounts increased from 2 611 in 2022/23 to 2 471 in 2020/21 mainly due to high staff
turnover within the department. In 2022/23 the personnel increases to 2 836 or 4.7 per cent. The
department reviewed its Organisational Structure supported by Human Resource Plan which is aligned to
the AET Strategy. Subsequently, the Provincial Committee Management Team (PCMT) approved critical
302 posts to be filled by the department during the 2022/23 financial year.
454