
Page 470 - Provincial Treasury Estimates.pdf
P. 470
Department: Rural Development and Agrarian Reform
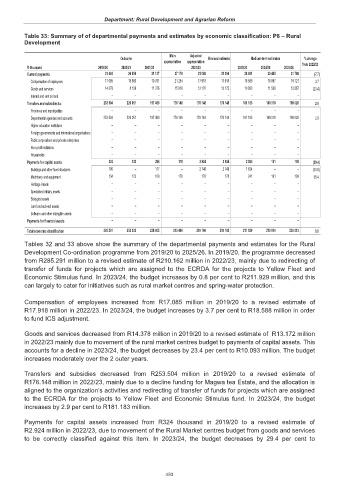
Table 33: Summary of of departmental payments and estimates by economic classification: P8 – Rural
Development
Main Adjusted
Outcome Revised estimate Medium-term estimates % change
appropriation appropriation from 2022/23
R thousand 2019/20 2020/21 2021/22 2022/23 2023/24 2024/25 2025/26
Current payments 31 463 26 858 31 137 37 170 31 088 31 090 28 681 30 405 31 788 (7.7)
Compensation of employees 17 085 18 660 19 761 21 254 17 918 17 918 18 588 18 867 19 721 3.7
Goods and services 14 378 8 198 11 376 15 916 13 170 13 172 10 093 11 538 12 067 (23.4)
–
–
–
–
–
–
–
–
Interest and rent on land –
Transfers and subsidies to: 253 504 226 051 197 480 176 148 176 148 176 148 181 183 189 318 198 026 2.9
–
–
–
–
–
–
–
–
Provinces and municipalities –
Departmental agencies and accounts 253 504 226 051 197 480 176 148 176 148 176 148 181 183 189 318 198 026 2.9
–
–
–
–
–
–
–
–
Higher education institutions –
–
–
–
–
–
–
–
–
–
Foreign governments and international organisations
–
–
–
–
–
–
–
–
Public corporations and private enterprises –
–
–
–
–
–
–
–
–
Non-profit institutions –
–
–
–
–
–
–
–
–
Households –
Payments for capital assets 324 123 286 178 2 924 2 924 2 065 191 199 (29.4)
–
–
–
Buildings and other fixed structures 190 177 2 746 2 746 1 824 – (33.6)
Machinery and equipment 134 123 109 178 178 178 241 191 199 35.4
–
–
–
–
–
–
–
–
Heritage Assets –
–
–
–
–
–
–
–
–
Specialised military assets –
–
–
–
–
–
–
–
–
Biological assets –
–
–
–
–
–
–
–
–
Land and sub-soil assets –
–
–
–
–
–
–
–
–
Software and other intangible assets –
–
–
–
–
–
–
–
–
Payments for financial assets –
Total economic classification 285 291 253 032 228 903 213 496 210 160 210 162 211 929 219 914 230 013 0.8
Tables 32 and 33 above show the summary of the departmental payments and estimates for the Rural
Development Co-ordination programme from 2019/20 to 2025/26. In 2019/20, the programme decreased
from R285.291 million to a revised estimate of R210.162 million in 2022/23, mainly due to redirecting of
transfer of funds for projects which are assigned to the ECRDA for the projects to Yellow Fleet and
Economic Stimulus fund. In 2023/24, the budget increases by 0.8 per cent to R211.929 million, and this
can largely to cater for initiatives such as rural market centres and spring-water protection.
Compensation of employees increased from R17.085 million in 2019/20 to a revised estimate of
R17.918 million in 2022/23. In 2023/24, the budget increases by 3.7 per cent to R18.588 million in order
to fund ICS adjustment.
Goods and services decreased from R14.378 million in 2019/20 to a revised estimate of R13.172 million
in 2022/23 mainly due to movement of the rural market centres budget to payments of capital assets. This
accounts for a decline in 2023/24, the budget decreases by 23.4 per cent to R10.093 million. The budget
increases moderately over the 2 outer years.
Transfers and subsidies decreased from R253.504 million in 2019/20 to a revised estimate of
R176.148 million in 2022/23, mainly due to a decline funding for Magwa tea Estate, and the allocation is
aligned to the organization’s activities and redirecting of transfer of funds for projects which are assigned
to the ECRDA for the projects to Yellow Fleet and Economic Stimulus fund. In 2023/24, the budget
increases by 2.9 per cent to R181.183 million.
Payments for capital assets increased from R324 thousand in 2019/20 to a revised estimate of
R2.924 million in 2022/23, due to movement of the Rural Market centres budget from goods and services
to be correctly classified against this item. In 2023/24, the budget decreases by 29.4 per cent to
453