
Page 519 - Provincial Treasury Estimates.pdf
P. 519
Estimates of the Provincial Revenue and Expenditure (EPRE) – 2023/24 Financial Year
7.3 Summary of economic classification
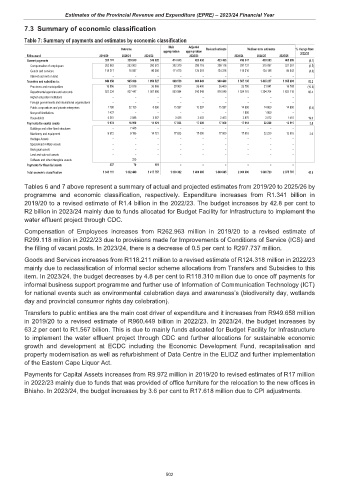
Table 7: Summary of payments and estimates by economic classification
Main Adjusted
Outcome Revised estimate Medium-term estimates % change from
appropriation appropriation
R thousand 2019/20 2020/21 2021/22 2022/23 2023/24 2024/25 2025/26 2022/23
Current payments 381 174 329 840 346 928 414 043 423 436 423 436 416 047 439 283 405 999 (1.7)
Compensation of employees 262 963 253 903 260 572 302 370 299 118 299 118 297 737 315 097 321 357 (0.5)
Goods and services 118 211 75 937 86 356 111 673 124 318 124 318 118 310 124 186 84 642 (4.8)
Interest and rent on land – – – – – – – – –
Transfers and subsidies to: 949 658 985 608 1 056 527 898 516 960 449 960 449 1 567 135 1 435 217 1 655 893 63.2
Provinces and municipalities 18 956 23 918 36 968 25 900 26 400 26 400 23 750 21 041 16 765 (10.0)
Departmental agencies and accounts 923 234 937 447 1 007 986 853 594 916 049 916 049 1 524 110 1 394 704 1 623 118 66.4
Higher education institutions – – – – – – – – –
Foreign governments and international organisations – – – – – – – – –
Public corporations and private enterprises 1 780 22 155 8 006 15 597 15 597 15 597 14 600 14 600 14 600 (6.4)
Non-profit institutions 1 427 – – – – – 1 800 1 800 –
Households 4 261 2 088 3 567 3 425 2 403 2 403 2 875 3 072 1 410 19.6
Payments for capital assets 9 972 16 950 14 121 17 823 17 000 17 000 17 618 22 220 13 815 3.6
Buildings and other fixed structures – 7 445 – – – – – – –
Machinery and equipment 9 972 9 185 14 121 17 823 17 000 17 000 17 618 22 220 13 815 3.6
Heritage Assets – – – – – – – – –
Specialised military assets – – – – – – – – –
Biological assets – – – – – – – – –
Land and sub-soil assets – – – – – – – – –
Software and other intangible assets – 320 – – – – – – –
Payments for financial assets 307 70 181 – – – – – –
Total economic classification 1 341 111 1 332 468 1 417 757 1 330 382 1 400 885 1 400 885 2 000 800 1 896 720 2 075 707 42.8
Tables 6 and 7 above represent a summary of actual and projected estimates from 2019/20 to 2025/26 by
programme and economic classification, respectively. Expenditure increases from R1.341 billion in
2019/20 to a revised estimate of R1.4 billion in the 2022/23. The budget increases by 42.8 per cent to
R2 billion in 2023/24 mainly due to funds allocated for Budget Facility for Infrastructure to implement the
water effluent project through CDC.
Compensation of Employees increases from R262.963 million in 2019/20 to a revised estimate of
R299.118 million in 2022/23 due to provisions made for Improvements of Conditions of Service (ICS) and
the filling of vacant posts. In 2023/24, there is a decrease of 0.5 per cent to R297.737 million.
Goods and Services increases from R118.211 million to a revised estimate of R124.318 million in 2022/23
mainly due to reclassification of informal sector scheme allocations from Transfers and Subsidies to this
item. In 2023/24, the budget decreases by 4.8 per cent to R118.310 million due to once off payments for
informal business support programme and further use of Information of Communication Technology (ICT)
for national events such as environmental celebration days and awareness’s (biodiversity day, wetlands
day and provincial consumer rights day celebration).
Transfers to public entities are the main cost driver of expenditure and it increases from R949.658 million
in 2019/20 to a revised estimate of R960.449 billion in 2022/23. In 2023/24, the budget increases by
63.2 per cent to R1.567 billion. This is due to mainly funds allocated for Budget Facility for Infrastructure
to implement the water effluent project through CDC and further allocations for sustainable economic
growth and development at ECDC including the Economic Development Fund, recapitalisation and
property modernisation as well as refurbishment of Data Centre in the ELIDZ and further implementation
of the Eastern Cape Liquor Act.
Payments for Capital Assets increases from R9.972 million in 2019/20 to revised estimates of R17 million
in 2022/23 mainly due to funds that was provided of office furniture for the relocation to the new offices in
Bhisho. In 2023/24, the budget increases by 3.6 per cent to R17.618 million due to CPI adjustments.
502