
Page 520 - Provincial Treasury Estimates.pdf
P. 520
Economic Development, Environmental Affairs and Tourism
7.4 Expenditure by municipal boundary
Table 8: Summary of departmental payments and estimates by benefiting municipal boundary
2019/20 2020/21 2021/22 2022/23 2023/24 2024/25 2025/26 % change
Audited outcome Preliminary Main Adjusted Revised Medium-term receipts estimate from
Outcome appropriation appropriation estimate 2022/23
Rand thousand
Buffalo City 1 217 252 1 131 458 1 188 696 1 284 792 1 313 257 1 313 257 1 604 778 1 207 260 1 188 594 22.2
Nelson Mandela Bay 104 903 177 092 192 093 19 690 61 228 61 228 372 272 668 419 870 348 508.0
Sarah Baartman District Municipality 2 670 2 494 10 386 10 000 10 000 10 000 2 000 - - (80.0)
Dr Beyers Naude - - - - - - - - -
Blue Crane Route - - 5 781 - - - - - -
Makana - - 2 000 5 000 5 000 5 000 - - - (100.0)
Ndlambe - - - - - - - - -
Sundays River Valley - - 2 605 - - - - - -
Kouga - - - 5 000 5 000 5 000 - - - (100.0)
Kou-Kamma 2 670 2 494 - - - - 2 000 - -
Amatole District Municipality 4 000 11 633 8 300 300 800 800 6 059 209 - 657.4
Mbhashe 4 000 - - - - - 3 859 - -
Mnquma - - 5 000 - - - - - -
Great Kei - - - - - - - - -
Amahlathi - 6 633 3 300 - - - - - -
Ngqushwa - - - - - - - - -
Raymond Mhlaba - 5 000 - 300 800 800 2 200 209 - 175.0
Chris Hani District Municipality 3 000 2 500 3 000 1 400 1 400 1 400 6 000 - - 328.6
Inxuba Yethemba 3 000 - - - - - - - -
Intsika Yethu - - - - - - - - -
Emalahleni - - 3 000 - - - - - -
Engcobo - - - 1 400 1 400 1 400 3 000 - - 114.3
Sakhisizwe - 2 500 - - - - - - -
Enoch Mgijima - - - - - - 3 000 - -
Joe Gqabi District Municipality 2 000 - 5 200 5 000 5 000 5 000 5 000 - - -
Elundini - - - - - - 5 000 - -
Senqu - - 5 200 - - - - - -
Walter Sisulu 2 000 - - 5 000 5 000 5 000 - - - (100.0)
O.R. Tambo District Municipality 3 000 2 500 5 582 1 000 1 000 1 000 - - - (100.0)
Ngquza Hill - - - - - - - - -
Port St Johns 3 000 - 5 582 - - - - - -
Nyandeni - - - 1 000 1 000 1 000 - - - (100.0)
Mhlontlo - - - - - - - - -
King Sabata Dalindyebo - 2 500 - - - - - - -
Alfred Nzo District Municipality 3 286 3 791 3 500 7 200 7 200 7 200 3 691 - - (48.7)
Matatiele - 3 791 - - - - 3 691 - -
Umzimvubu - - 3 500 3 700 3 700 3 700 - - - (100.0)
Mbizana 3 286 - - - - - - - -
Ntabankulu - - - 3 500 3 500 3 500 - - - (100.0)
District Municipalities - - - - - - - - -
Sarah Baartman District Municipality - - - - - - - - -
Amatole District Municipality - - - - - - - - -
Chris Hani District Municipality - - - - - - - - -
Joe Gqabi District Municipality - - - - - - - - -
O.R. Tambo District Municipality - - - - - - - - -
Alfred Nzo District Municipality - - - - - - - - -
Whole Province 1 000 1 000 1 000 1 000 1 000 1 000 1 000 20 832 16 765 -
Total payments and estimates by district and municipal area
1 341 111 1 332 468 1 417 757 1 330 382 1 400 885 1 400 885 2 000 800 1 896 720 2 075 707 42.8
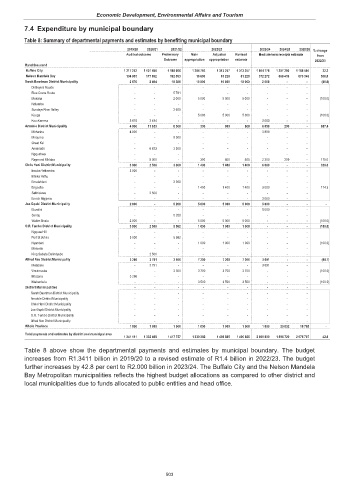
Table 8 above show the departmental payments and estimates by municipal boundary. The budget
increases from R1.3411 billion in 2019/20 to a revised estimate of R1.4 billion in 2022/23. The budget
further increases by 42.8 per cent to R2.000 billion in 2023/24. The Buffalo City and the Nelson Mandela
Bay Metropolitan municipalities reflects the highest budget allocations as compared to other district and
local municipalities due to funds allocated to public entities and head office.
503