
Page 522 - Provincial Treasury Estimates.pdf
P. 522
Economic Development, Environmental Affairs and Tourism
7.7 Transfers
7.7.1 Transfers to public entities
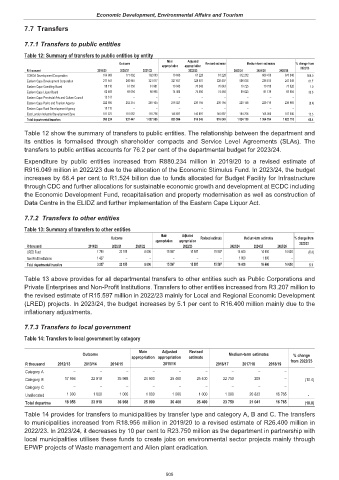
Table 12: Summary of transfers to public entities by entity
Main Adjusted
Outcome Revised estimate Medium-term estimates % change from
appropriation appropriation
R thousand 2019/20 2020/21 2021/22 2022/23 2023/24 2024/25 2025/26 2022/23
COEGA Development Cooperation 104 903 177 092 192 093 19 690 61 228 61 228 372 272 668 419 870 348 508.0
Eastern Cape Development Corporation 217 841 266 945 321 017 327 657 328 407 328 407 596 636 238 615 247 349 81.7
Eastern Cape Gambling Board 58 710 61 350 61 961 70 043 70 043 70 043 70 725 70 756 73 926 1.0
Eastern Cape Liquor Board 62 483 69 094 68 995 74 480 74 480 74 480 99 623 81 139 83 984 33.8
Eastern Cape Provincial Arts and Culture Council 13 311 – – – – – – – –
Eastern Cape Parks and Tourism Agency 222 695 252 314 245 164 215 027 235 194 235 194 220 148 229 719 239 965 (6.4)
Eastern Cape Rural Development Agency 18 715 – – – – – – – –
East London Industrial Development Zone 181 575 110 652 118 756 146 697 146 697 146 697 164 706 106 056 107 546 12.3
Total departmental transfers 880 234 937 447 1 007 986 853 594 916 049 916 049 1 524 110 1 394 704 1 623 118 66.4
Table 12 show the summary of transfers to public entities. The relationship between the department and
its entities is formalised through shareholder compacts and Service Level Agreements (SLAs). The
transfers to public entities accounts for 76.2 per cent of the departmental budget for 2023/24.
Expenditure by public entities increased from R880.234 million in 2019/20 to a revised estimate of
R916.049 million in 2022/23 due to the allocation of the Economic Stimulus Fund. In 2023/24, the budget
increases by 66.4 per cent to R1.524 billion due to funds allocated for Budget Facility for Infrastructure
through CDC and further allocations for sustainable economic growth and development at ECDC including
the Economic Development Fund, recapitalisation and property modernisation as well as construction of
Data Centre in the ELIDZ and further implementation of the Eastern Cape Liquor Act.
7.7.2 Transfers to other entities
Table 13: Summary of transfers to other entities
Main Adjusted
Outcome Revised estimate Medium-term estimates % change from
appropriation appropriation
R thousand 2019/20 2020/21 2021/22 2022/23 2023/24 2024/25 2025/26 2022/23
LRED Fund 1 780 22 155 8 006 15 597 15 597 15 597 14 600 14 600 14 600 (6.4)
Non Profit Institutions 1 427 – – – – – 1 800 1 800 –
Total departmental transfers 3 207 22 155 8 006 15 597 15 597 15 597 16 400 16 400 14 600 5.1
Table 13 above provides for all departmental transfers to other entities such as Public Corporations and
Private Enterprises and Non-Profit Institutions. Transfers to other entities increased from R3.207 million to
the revised estimate of R15.597 million in 2022/23 mainly for Local and Regional Economic Development
(LRED) projects. In 2023/24, the budget increases by 5.1 per cent to R16.400 million mainly due to the
inflationary adjustments.
7.7.3 Transfers to local government
Table 14: Transfers to local government by category
Main Adjusted Revised
Outcome Medium-term estimates % change
appropriation appropriation estimate
R thousand 2012/13 2013/14 2014/15 2015/16 2016/17 2017/18 2018/19 from 2022/23
Category A – – – – – – – – –
Category B 17 956 22 918 35 968 24 900 25 400 25 400 22 750 209 – (10.4)
Category C – – – – – – – – –
Unallocated 1 000 1 000 1 000 1 000 1 000 1 000 1 000 20 832 16 765 -
Total departme 18 956 23 918 36 968 25 900 26 400 26 400 23 750 21 041 16 765 (10.0)
Table 14 provides for transfers to municipalities by transfer type and category A, B and C. The transfers
to municipalities increased from R18.956 million in 2019/20 to a revised estimate of R26.400 million in
2022/23. In 2023/24, it decreases by 10 per cent to R23.750 million as the department in partnership with
local municipalities utilises these funds to create jobs on environmental sector projects mainly through
EPWP projects of Waste management and Alien plant eradication.
505