
Page 521 - Provincial Treasury Estimates.pdf
P. 521
Estimates of the Provincial Revenue and Expenditure (EPRE) – 2023/24 Financial Year
7.5 Infrastructure payments
7.5.1 Departmental Infrastructure payments
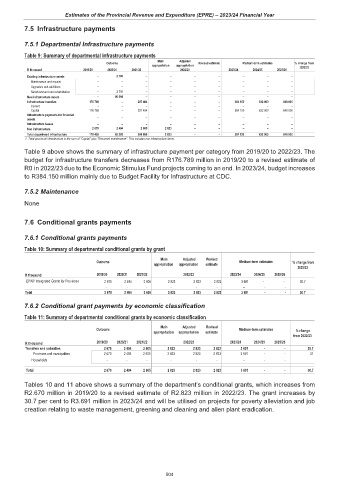
Table 9: Summary of departmental infrastructure payments
Main Adjusted
Outcome Revised estimate Medium-term estimates % change from
appropriation appropriation
R thousand 2019/20 2020/21 2021/22 2022/23 2023/24 2024/25 2025/26 2022/23
Existing infrastructure assets – 2 700 – – – – – – –
Maintenance and repairs – – – – – – – – –
Upgrades and additions – – – – – – – – –
Refurbishment and rehabilitation – 2 700 – – – – – – –
New infrastructure assets – 80 008 – – – – – – –
Infrastructure transfers 176 789 – 297 484 – – – 384 150 632 000 848 000
Current – – – – – – – – –
Capital 176 789 – 297 484 – – – 384 150 632 000 848 000
Infrastructure payments for financial
assets – – – – – – – – –
Infrastructure leases – – – – – – – – –
Non infrastructure 2 670 2 494 2 605 2 823 – – – – –
Total department infrastructure 179 459 85 202 300 089 2 823 – – 384 150 632 000 848 000
1. Total provincial infrastructure is the sum of "Capital" plus "Recurrent maintenance". This includes non infrastructure items.
Table 9 above shows the summary of infrastructure payment per category from 2019/20 to 2022/23. The
budget for infrastructure transfers decreases from R176.789 million in 2019/20 to a revised estimate of
R0 in 2022/23 due to the Economic Stimulus Fund projects coming to an end. In 2023/24, budget increases
to R384.150 million mainly due to Budget Facility for Infrastructure at CDC.
7.5.2 Maintenance
None
7.6 Conditional grants payments
7.6.1 Conditional grants payments
Table 10: Summary of departmental conditional grants by grant
Main Adjusted Revised
Outcome Medium-term estimates % change from
appropriation appropriation estimate
2022/23
R thousand 2019/20 2020/21 2021/22 2022/23 2023/24 2024/25 2025/26
EPWP Intergrated Grants for Provinces 2 670 2 494 2 605 2 823 2 823 2 823 3 691 - - 30.7
- - - - - - - - -
Total 2 670 2 494 2 605 2 823 2 823 2 823 3 691 - - 30.7
7.6.2 Conditional grant payments by economic classification
Table 11: Summary of departmental conditional grants by economic classification
Main Adjusted Revised
Outcome Medium-term estimates % change
appropriation appropriation estimate
from 2022/23
R thousand 2019/20 2020/21 2021/22 2022/23 2023/24 2024/25 2025/26
Transfers and subsidies 2 670 2 494 2 605 2 823 2 823 2 823 3 691 - - 30.7
Provinces and municipalities 2 670 2 494 2 605 2 823 2 823 2 823 3 691 - - 31
Households - - - - - - - - -
Total 2 670 2 494 2 605 2 823 2 823 2 823 3 691 - - 30.7
Tables 10 and 11 above shows a summary of the department’s conditional grants, which increases from
R2.670 million in 2019/20 to a revised estimate of R2.823 million in 2022/23. The grant increases by
30.7 per cent to R3.691 million in 2023/24 and will be utilised on projects for poverty alleviation and job
creation relating to waste management, greening and cleaning and alien plant eradication.
504