
Page 528 - Provincial Treasury Estimates.pdf
P. 528
Economic Development, Environmental Affairs and Tourism
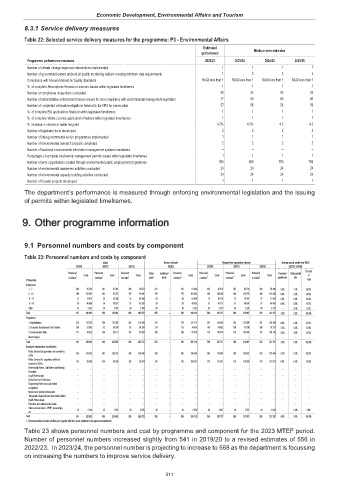
8.3.1 Service delivery measures
Table 22: Selected service delivery measures for the programme: P3 - Environmental Affairs
Estimated Medium-term estimates
performance
Programme performance measures 2022/23 2023/24 2024/25 2025/26
Number of climate change response interventions implemented 1 1 1 1
Number of government-owned ambient air quality monitoring stations meeting minimum data requirements 1 3 3 3
Compliance with Annual Ambient Air Quality Standards NAQI less than 1 NAQI less than 1 NAQI less than 1 NAQI less than 1
% of complete Atmospheric Emission Licenses issued within legislated timeframes 1 1 1 1
Number of compliance inspections conducted 90 92 92 92
Number of administrative enforcement notices issued for non-compliance with environmental management legislation 77 80 80 80
Number of completed criminalinvestigations handed to the NPA for prosecution 57 56 56 56
% of complete EIA applications finalized within legislated timeframes 1 1 1 1
% of complete Waste License applications finalised within legislated time-frames 1 1 1 1
% increase in volume of waste recycled 4.2% 4.2% 4.2 4.2
Number of legislated tools developed 2 2 2 2
Number of inter-governmental sector programmes implemented 1 1 1 1
Number of environmental research projects completed 2 2 2 2
Number of functional environmental information management systems maintained – – – –
Percentage of complete biodiversity management permits issued within legislated timeframes. 1 1 1 1
Number of work opportunities created through environmental public employment programmes 550 600 750 750
Number of environmental awareness activities conducted 24 24 24 24
Number of environmental capacity building activities conducted 24 24 24 24
Number of Coastal projects developed 1 1 1 1
The department’s performance is measured through enforcing environmental legislation and the issuing
of permits within legislated timeframes.
9.. Other programme information
9.1 Personnel numbers and costs by component
Table 23: Personnel numbers and costs by component
Actual Revised estimate Medium-term expenditure estimate Average annual growth over MTEF
2019/20 2020/21 2021/22 2022/23 2023/24 2024/25 2025/26 2022/23 - 2025/26
% Costs
Personnel Costs Personnel Costs Personnel Costs Filled Additional Personnel Costs Personnel Costs Personnel Costs Personnel Costs Personnel Costs growth of
numbers 1 numbers 1 numbers 1 posts posts numbers 1 numbers 1 numbers 1 numbers 1 growth rate rate
R thousands Total
Salary level
1 – 7 268 29 782 241 67 346 266 56 972 241 – 241 81 336 245 82 270 245 83 730 203 85 446 -5.6% 1.7% 26.8%
8 – 10 166 132 901 163 92 372 147 91 641 178 – 178 103 093 180 106 346 180 110 276 180 112 438 0.4% 2.9% 34.8%
11 – 12 37 57 832 36 53 306 52 62 596 69 – 69 63 640 76 63 128 76 70 291 76 71 654 3.3% 4.0% 22.0%
13 – 16 38 40 096 34 38 527 31 47 202 38 – 38 48 826 37 43 771 37 48 574 37 49 547 -0.9% 0.5% 15.7%
Other 32 2 352 26 2 352 30 2 160 30 – 30 2 223 30 2 223 30 2 226 30 2 272 – 0.7% 0.7%
Total 541 262 963 500 253 903 526 260 572 556 – 556 299 118 568 297 737 568 315 097 526 321 357 -1.8% 2.4% 100.0%
Programme
1. Administration 270 117 238 254 113 582 282 115 289 274 – 274 127 117 281 124 366 281 133 694 281 136 368 0.8% 2.4% 42.5%
2. Economic Development And Tourism 100 57 902 92 55 209 91 58 190 113 – 113 74 576 108 70 452 108 73 798 108 75 273 -1.5% 0.3% 23.9%
3. Environmental Affairs 171 87 823 154 85 112 153 87 093 169 – 169 97 425 179 102 919 179 107 605 137 109 716 -6.8% 4.0% 33.6%
Direct charges – – – – – – – – – – – – – – – – – – –
Total 541 262 963 500 253 903 526 260 572 556 – 556 299 118 568 297 737 568 315 097 526 321 357 -1.8% 2.4% 100.0%
Employee dispensation classification
Public Service Act appointees not covered by 330 167 363 301 163 139 334 164 943 350 – 350 196 036 360 179 509 360 193 801 318 197 443 -3.1% 0.2% 62.8%
OSDs
Public Service Act appointees still to be 176 93 500 164 88 209 162 93 074 176 – 176 100 527 178 115 561 178 118 509 178 121 071 0.4% 6.4% 36.4%
covered by OSDs
Professional Nurses, Staff Nurses and Nursing – – – – – – – – – – – – – – – – – – –
Assistants
Legal Professionals – – – – – – – – – – – – – – – – – – –
Social Services Professions – – – – – – – – – – – – – – – – – – –
Engineering Professions and related
occupations – – – – – – – – – – – – – – – – – – –
Medical and related professionals – – – – – – – – – – – – – – – – – – –
Therapeutic, Diagnostic and other related Allied – – – – – – – – – – – – – – – – – – –
Health Professionals
Educators and related professionals – – – – – – – – – – – – – – – – – – –
Others such as interns, EPWP, learnerships, 35 2 100 35 2 555 30 2 555 30 – 30 2 555 30 2 667 30 2 787 30 2 843 – 3.6% 0.9%
etc
Total 541 262 963 500 253 903 526 260 572 556 – 556 299 118 568 297 737 568 315 097 526 321 357 -1.8% 2.4% 100.0%
1. Personnel numbers includes all filled posts together with those posts additional to the approved establishment
Table 23 shows personnel numbers and cost by programme and component for the 2023 MTEF period.
Number of personnel numbers increased slightly from 541 in 2019/20 to a revised estimates of 556 in
2022/23. In 2023/24, the personnel number is projecting to increase to 568 as the department is focussing
on increasing the numbers to improve service delivery.
511