Page 529 - Provincial Treasury Estimates.pdf
P. 529

Estimates of the Provincial Revenue and Expenditure (EPRE) – 2023/24 Financial Year
           9.2 Training

            Table 24: Information on training
                                                         Main    Adjusted
                                       Outcome                         Revised estimate  Medium-term estimates  % change from
                                                       appropriation  appropriation                        2022/23
            R thousand         2019/20  2020/21  2021/22         2022/23          2023/24  2024/25  2025/26
            Number of staff        541     500      526     556      556     556      568     568        568  2.2
             Number of personnel trained  228  147  231     180      180     180      300     340        350  66.7
               of which
                Male               90       65      91       75      75       75      150     160        170  100.0

                Female             138      82      140     105      105     105      150     180      180    42.9
              Number of training opportunities  29  17  77   80      80       80      83       85      90     3.8
               of which
                Tertiary           10       4       10       5        5       5        8       10      15     60.0
                Workshops           3       4        2       5        5       5        5       5        5     0.0
                Seminars            7       1        –       5        5       5        5       5        5     0.0
                Other               9       8       65       65      65       65      65       65      65     0.0
              Number of bursaries offered  40  35   75       30      30       30      80       85      90    166.7
              Number of interns appointed  24  25   30       30      30       30      30       30      30     0.0
              Number of learnerships appointed  34  –  30    30      30       30      30       30      30     0.0
              Number of days spent on training  59  65                         61  70  70  70  75  80  95     7.1
            Payments on training by programme
            1. Administration                      1 758                     1 190                     1 646                     2 002                     2 102                     2 102                     2 002                     2 081                     1 352  (4.8)
            2. Economic Development  And Touri  –  –  –      –        –       –        –       –        –
            3. Environmental  Affairs  –    –        –       –        –       –        –       –          –
            Total payments on training                      1 758                     1 190                     1 646                     2 002                     2 102                     2 102                     2 002                     2 081                     1 352  (4.8)
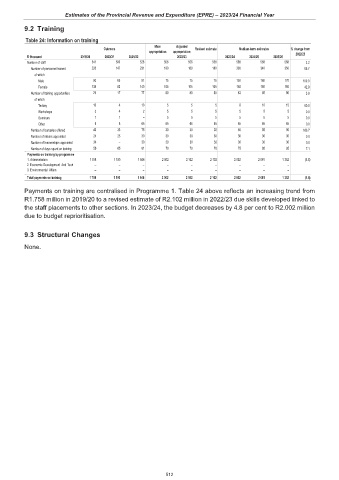
           Payments on training are centralised in Programme 1. Table 24 above reflects an increasing trend from
           R1.758 million in 2019/20 to a revised estimate of R2.102 million in 2022/23 due skills developed linked to
           the staff placements to other sections. In 2023/24, the budget decreases by 4.8 per cent to R2.002 million
           due to budget reprioritisation.


           9.3 Structural Changes
           None.


                                                             512
   524   525   526   527   528   529   530   531   532   533   534