
Page 554 - Provincial Treasury Estimates.pdf
P. 554
Department: of Transport
Summary of economic classification
Table 7: Summary of payments and estimates by economic classification
Main Adjusted
Outcome Revised estimate Medium-term estimates % change from
appropriation appropriation 2022/23
R thousand 2019/20 2020/21 2021/22 2022/23 2023/24 2024/25 2025/26
Current payments 3 637 802 3 204 870 3 594 206 3 532 652 3 920 628 3 930 459 3 791 027 3 753 791 3 923 979 (3.5)
Compensation of employees 998 709 994 216 998 053 1 121 277 1 081 095 1 071 248 1 191 783 1 242 269 1 299 768 11.3
Goods and services 2 638 897 2 210 211 2 596 148 2 411 375 2 839 533 2 859 160 2 599 244 2 511 522 2 624 211 (9.1)
Interest and rent on land 196 443 5 – – 51 – – – (100.0)
Transfers and subsidies to: 609 261 590 938 676 517 689 066 726 710 720 431 807 013 748 651 782 190 12.0
Provinces and municipalities 3 858 14 535 5 722 3 750 23 789 17 540 14 932 5 227 5 461 (14.9)
Departmental agencies and accounts 19 676 15 527 16 234 15 417 23 863 23 833 15 251 15 049 15 723 (36.0)
Higher education institutions – – – – – – – – –
Foreign governments and international organisations – – – – – – – – –
Public corporations and private enterprises 544 863 535 013 616 165 637 196 637 196 637 196 735 314 684 074 714 720 15.4
Non-profit institutions – – – – – – – – –
Households 40 865 25 863 38 396 32 703 41 862 41 862 41 516 44 301 46 286 (0.8)
Payments for capital assets 661 206 822 731 952 105 712 402 932 149 928 755 1 091 847 674 856 705 090 17.6
Buildings and other fixed structures 473 696 757 952 874 654 612 894 855 921 856 054 1 035 755 606 849 634 036 21.0
Machinery and equipment 187 277 58 274 66 883 82 209 70 866 67 338 55 541 67 681 70 713 (17.5)
Heritage Assets – – – – – – – – –
Specialised military assets – – – – – – – – –
Biological assets – – – – – – – – –
Land and sub-soil assets – – – – – – – – –
Software and other intangible assets 233 6 505 10 568 17 299 5 362 5 362 551 326 341 (89.7)
Payments for financial assets 2 – 463 – – – – – –
Total economic classification 4 908 271 4 618 538 5 223 291 4 934 120 5 579 487 5 579 645 5 689 887 5 177 298 5 411 259 2.0
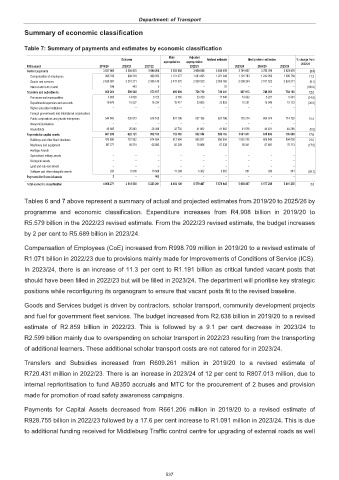
Tables 6 and 7 above represent a summary of actual and projected estimates from 2019/20 to 2025/26 by
programme and economic classification. Expenditure increases from R4.908 billion in 2019/20 to
R5.579 billion in the 2022/23 revised estimate. From the 2022/23 revised estimate, the budget increases
by 2 per cent to R5.689 billion in 2023/24.
Compensation of Employees (CoE) increased from R998.709 million in 2019/20 to a revised estimate of
R1.071 billion in 2022/23 due to provisions mainly made for Improvements of Conditions of Service (ICS).
In 2023/24, there is an increase of 11.3 per cent to R1.191 billion as critical funded vacant posts that
should have been filled in 2022/23 but will be filled in 2023/24. The department will prioritise key strategic
positions while reconfiguring its organogram to ensure that vacant posts fit to the revised baseline.
Goods and Services budget is driven by contractors, scholar transport, community development projects
and fuel for government fleet services. The budget increased from R2.638 billion in 2019/20 to a revised
estimate of R2.859 billion in 2022/23. This is followed by a 9.1 per cent decrease in 2023/24 to
R2.599 billion mainly due to overspending on scholar transport in 2022/23 resulting from the transporting
of additional learners. These additional scholar transport costs are not catered for in 2023/24.
Transfers and Subsidies increased from R609.261 million in 2019/20 to a revised estimate of
R720.431 million in 2022/23. There is an increase in 2023/24 of 12 per cent to R807.013 million, due to
internal reprioritisation to fund AB350 accruals and MTC for the procurement of 2 buses and provision
made for promotion of road safety awareness campaigns.
Payments for Capital Assets decreased from R661.206 million in 2019/20 to a revised estimate of
R928.755 billion in 2022/23 followed by a 17.6 per cent increase to R1.091 million in 2023/24. This is due
to additional funding received for Middleburg Traffic control centre for upgrading of external roads as well
537