
Page 559 - Provincial Treasury Estimates.pdf
P. 559
Estimates of the Provincial Revenue and Expenditure (EPRE) – 2023/24 Financial Year
8. 8. Programme description
8.1 Programme 1: Administration
Objectives: The Administration programme provides the department with the overall management,
administrative, strategic, financial and corporate support services in order to ensure that it delivers on its
mandate in an integrated, efficient, effective and sustainable manner. The programme is divided into 4 sub-
programmes:
x Office of the MEC renders advisory, parliamentary, secretarial, administrative and office support
services;
x Management implements overall management and support of the department;
x Corporate Support manages personnel, procurement, finance, administration and related support
services; and
x Departmental Strategy provides operational support in terms of strategic management, strategic
planning, monitoring and evaluation, integrated planning and coordination across spheres of
government including policy development and coordination.
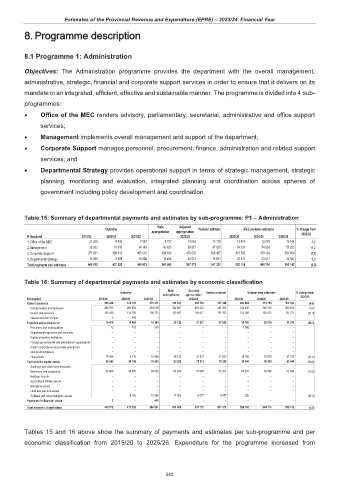
Table 15: Summary of departmental payments and estimates by sub-programme: P1 – Administration
Main Adjusted
Outcome Revised estimate Medium-term estimates % change from
appropriation appropriation 2022/23
R thousand 2019/20 2020/21 2021/22 2022/23 2023/24 2024/25 2025/26
1. Office of the MEC 21 200 8 343 7 567 9 707 13 063 13 119 13 674 12 579 13 144 4.2
2. Management 36 922 31 310 34 149 40 825 38 971 47 925 54 231 54 834 57 293 13.2
3. Corporate Support 371 831 388 013 408 212 496 839 474 525 466 467 431 392 474 284 500 658 (7.5)
4. Departmental Strategy 15 559 9 686 16 994 14 494 20 613 19 821 20 811 23 017 24 047 5.0
Total payments and estimates 445 512 437 352 466 921 561 865 547 172 547 331 520 108 564 714 595 142 (5.0)
Table 16: Summary of departmental payments and estimates by economic classification
Main Adjusted
Outcome Revised estimate Medium-term estimates % change from
appropriation appropriation
R thousand 2019/20 2020/21 2021/22 2022/23 2023/24 2024/25 2025/26 2022/23
Current payments 366 228 372 140 373 371 436 534 433 738 437 348 434 804 474 785 501 184 (0.6)
Compensation of employees 260 789 260 902 264 619 302 687 284 321 281 585 312 298 349 310 369 913 10.9
Goods and services 105 439 110 795 108 752 133 847 149 417 155 763 122 506 125 475 131 271 (21.4)
Interest and rent on land 0 443 – – – – – – –
Transfers and subsidies to: 16 416 10 469 16 184 26 122 37 521 37 655 30 760 29 970 31 313 (18.3)
Provinces and municipalities 12 753 518 – – – 1 000 – –
Departmental agencies and accounts – – – – – – – – –
Higher education institutions – – – – – – – – –
Foreign governments and international organisations – – – – – – – – –
Public corporations and private enterprises – – – – – – – – –
Non-profit institutions – – – – – – – – –
Households 16 404 9 716 15 666 26 122 37 521 37 655 29 760 29 970 31 313 (21.0)
Payments for capital assets 62 866 54 743 76 903 99 209 75 913 72 328 54 544 59 959 62 645 (24.6)
Buildings and other fixed structures – – – – – – – – –
Machinery and equipment 62 866 48 600 66 336 82 209 70 836 67 251 54 291 59 959 62 645 (19.3)
Heritage Assets – – – – – – – – –
Specialised military assets – – – – – – – – –
Biological assets – – – – – – – – –
Land and sub-soil assets – – – – – – – – –
Software and other intangible assets – 6 143 10 568 17 000 5 077 5 077 253 – – (95.0)
Payments for financial assets 2 – 463 – – – – – –
Total economic classification 445 512 437 352 466 921 561 865 547 172 547 331 520 108 564 714 595 142 (5.0)
Tables 15 and 16 above show the summary of payments and estimates per sub-programme and per
economic classification from 2019/20 to 2025/26. Expenditure for the programme increased from
542