
Page 557 - Provincial Treasury Estimates.pdf
P. 557
Estimates of the Provincial Revenue and Expenditure (EPRE) – 2023/24 Financial Year
7.4 Conditional grants payments
7.4.1 Conditional grant payments by grant
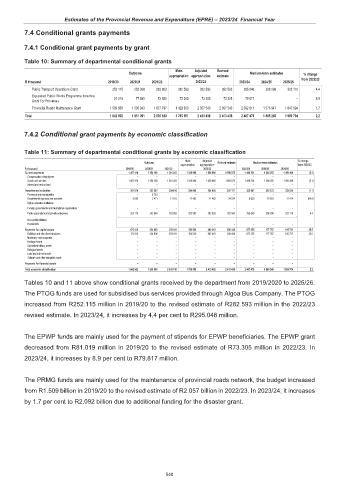
Table 10: Summary of departmental conditional grants
Main Adjusted Revised
Outcome Medium-term estimates % change
appropriation appropriation estimate
R thousand 2019/20 2020/21 2021/22 2022/23 2023/24 2024/25 2025/26 from 2022/23
Public Transport Operations Grant 252 115 252 368 283 803 282 593 282 593 282 593 295 048 308 298 322 110 4.4
Expanded Public Works Programme Incentive 81 019 77 880 73 580 73 305 73 305 73 305 79 817 – 8.9
Grant For Provinces
Provincial Roads Maintenance Grant 1 509 668 1 500 843 1 677 797 1 429 653 2 057 540 2 057 540 2 092 611 1 576 947 1 647 594 1.7
Total 1 842 802 1 831 091 2 035 180 1 785 551 2 413 438 2 413 438 2 467 476 1 885 245 1 969 704 2.2
7.4.2 Conditional grant payments by economic classification
Table 11: Summary of departmental conditional grants by economic classification
Main Adjusted % change
Outcome Revised estimate Medium-term estimates
appropriation appropriation from 2022/23
R thousand 2019/20 2020/21 2021/22 2022/23 2023/24 2024/25 2025/26
Current payments 1 407 416 1 354 189 1 381 203 1 336 966 1 656 966 1 566 875 1 486 534 1 388 255 1 450 449 (5.1)
Compensation of employees – – – – – – – – –
Goods and services 1 407 416 1 354 189 1 381 203 1 336 966 1 656 966 1 566 875 1 486 534 1 388 255 1 450 449 (5.1)
Interest and rent on land – – – – – – – – –
Transfers and subsidies 261 974 252 302 294 816 294 056 294 056 307 127 303 687 319 223 333 524 (1.1)
Provinces and municipalities – 6 783 – – – – – – –
Departmental agencies and accounts 9 859 3 471 11 013 11 463 11 463 24 534 8 639 10 925 11 414 (64.8)
Higher education institutions – – – – – – – – –
Foreign governments and international organisations – – – – – – – – –
Public corporations and private enterprises 252 115 242 048 283 803 282 593 282 593 282 593 295 048 308 298 322 110 4.4
Non-profit institutions
Households – – – – – – – – –
Payments for capital assets 173 412 224 600 359 161 154 529 462 416 539 436 677 255 177 767 185 731 25.5
Buildings and other fixed structures 173 412 224 600 359 161 154 529 462 416 539 436 677 255 177 767 185 731 25.5
Machinery and equipment – – – – – – – – –
Heritage Assets – – – – – – – – –
Specialised military assets – – – – – – – – –
Biological assets – – – – – – – – –
Land and sub-soil assets – – – – – – – – –
Software and other intangible assets – – – – – – – – –
Payments for financial assets – – – – – – – – –
Total economic classification 1 842 802 1 831 091 2 035 180 1 785 551 2 413 438 2 413 438 2 467 476 1 885 245 1 969 704 2.2
Tables 10 and 11 above show conditional grants received by the department from 2019/2020 to 2025/26.
The PTOG funds are used for subsidised bus services provided through Algoa Bus Company. The PTOG
increased from R252.115 million in 2019/20 to the revised estimate of R282.593 million in the 2022/23
revised estimate. In 2023/24, it increases by 4.4 per cent to R295.048 million.
The EPWP funds are mainly used for the payment of stipends for EPWP beneficiaries. The EPWP grant
decreased from R81.019 million in 2019/20 to the revised estimate of R73.305 million in 2022/23. In
2023/24, it increases by 8.9 per cent to R79.817 million.
The PRMG funds are mainly used for the maintenance of provincial roads network, the budget increased
from R1.509 billion in 2019/20 to the revised estimate of R2.057 billion in 2022/23. In 2023/24, it increases
by 1.7 per cent to R2.092 billion due to additional funding for the disaster grant.
540