
Page 555 - Provincial Treasury Estimates.pdf
P. 555
Estimates of the Provincial Revenue and Expenditure (EPRE) – 2023/24 Financial Year
as weigh bridge, pound and parking and also the building of modular steel bridges under the Welisizwe
Rural Programme.
7.2 Expenditure by municipal boundary
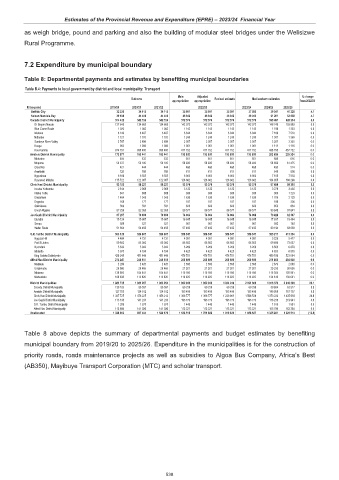
Table 8: Departmental payments and estimates by benefiting municipal boundaries
Table B.4: Payments to local government by district and local municipality: Transport
Main Adjusted % change
Outcome Revised estimate Medium-term estimates
appropriation appropriation from 2022/23
R thousand 2019/20 2020/21 2021/22 2022/23 2023/24 2024/25 2025/26
Buffalo City 32 336 34 115 34 115 35 991 35 991 35 991 37 683 39 341 41 229 4.7
Nelson Mandela Bay 39 198 44 400 44 400 46 842 46 842 46 842 49 043 51 201 53 658 4.7
Cacadu District Municipality 514 432 542 726 542 726 572 576 572 576 572 576 572 576 599 487 628 214 0.0
Dr Beyers Naude 127 645 134 665 134 665 142 072 142 072 142 072 142 072 148 749 155 889 0.0
Blue Crane Route 1 026 1 082 1 082 1 142 1 142 1 142 1 142 1 196 1 253 0.0
Makana 6 149 6 487 6 487 6 844 6 844 6 844 6 844 7 166 7 510 0.0
Ndlambe 1 121 1 183 1 183 1 248 1 248 1 248 1 248 1 307 1 369 0.0
Sundays River Valley 2 747 2 898 2 898 3 057 3 057 3 057 3 057 3 201 3 355 0.0
Kouga 953 1 006 1 006 1 061 1 061 1 061 1 061 1 111 1 116 0.0
Kou-Kamma 374 791 395 405 395 405 417 152 417 152 417 152 417 152 436 758 457 722 0.0
Amatole District Municipality 173 877 183 441 183 441 193 530 193 530 193 530 193 530 202 626 239 324 0.0
Mbhashe 504 532 532 561 561 561 561 588 616 0.0
Mnquma 50 337 53 105 53 105 56 026 56 026 56 026 56 026 58 659 61 475 0.0
Great Kei 421 444 444 468 468 468 468 490 514 0.0
Amahlathi 728 768 768 811 811 811 811 849 890 0.0
Ngqushwa 6 166 6 505 6 505 6 863 6 863 6 863 6 863 7 185 7 530 0.0
Raymond Mhlaba 115 722 122 087 122 087 128 802 128 802 128 802 128 802 134 855 168 299 0.0
Chris Hani District Municipality 93 106 88 227 88 227 93 079 93 079 93 079 93 079 97 454 99 318 0.0
Inxuba Yethemba 2 814 2 968 2 968 3 132 3 132 3 132 3 132 3 279 3 436 0.0
Intsika Yethu 841 888 888 936 936 936 936 980 1 223 0.0
Emalahleni 1 464 1 545 1 545 1 630 1 630 1 630 1 630 1 706 2 129 0.0
Engcobo 168 177 177 187 187 187 187 196 205 0.0
Sakhisizwe 560 591 591 623 623 623 623 653 684 0.0
Enoch Mgijima 87 259 82 058 82 058 86 571 86 571 86 571 86 571 90 640 91 641 0.0
Joe Gqabi District Municipality 67 297 70 999 70 999 74 904 74 904 74 904 74 904 78 424 82 307 0.0
Elundini 15 134 15 967 15 967 16 845 16 845 16 845 16 845 17 637 18 484 0.0
Senqu 509 537 537 567 567 567 567 593 740 0.0
Walter Sisulu 51 654 54 495 54 495 57 492 57 492 57 492 57 492 60 194 63 083 0.0
O.R. Tambo District Municipality 503 139 529 807 529 807 558 947 558 947 558 947 558 947 585 217 615 354 0.0
Ngquza Hill 4 484 4 731 4 731 4 991 4 991 4 991 4 991 5 226 5 477 0.0
Port St Johns 59 802 63 092 63 092 66 562 66 562 66 562 66 562 69 690 73 037 0.0
Nyandeni 5 632 5 942 5 942 6 269 6 269 6 269 6 269 6 563 6 878 0.0
Mhlontlo 3 975 4 194 4 194 4 425 4 425 4 425 4 425 4 633 6 878 0.0
King Sabata Dalindyebo 429 245 451 849 451 849 476 701 476 701 476 701 476 701 499 106 523 084 0.0
Alfred Nzo District Municipality 274 247 246 151 246 151 259 690 259 690 259 690 259 690 271 895 284 946 0.0
Matatiele 2 299 2 425 2 425 2 558 2 558 2 558 2 558 2 679 2 808 0.0
Umzimvubu 25 086 26 465 26 465 27 921 27 921 27 921 27 921 29 233 30 636 0.0
Mbizana 139 925 104 441 104 441 110 185 110 185 110 185 110 185 115 364 120 901 0.0
Ntabankulu 106 938 112 820 112 820 119 025 119 025 119 025 119 025 124 619 130 601 0.0
District Municipalities 1 881 735 1 981 267 1 963 254 1 962 046 1 962 046 1 824 249 2 191 808 1 916 370 2 040 399 20.1
Cacadu District Municipality 138 103 86 591 86 591 69 239 69 239 69 239 69 239 59 654 62 517 0.0
Amatole District Municipality 127 785 134 812 134 812 155 490 155 490 155 490 155 490 149 959 157 157 0.0
Chris Hani District Municipality 1 387 725 1 476 225 1 458 212 1 366 777 1 366 777 1 228 981 1 596 539 1 373 223 1 435 939 29.9
Joe Gqabi District Municipality 113 138 141 233 141 233 195 773 195 773 195 773 195 773 176 235 219 941 0.0
O.R. Tambo District Municipality 1 299 1 370 1 370 1 445 1 445 1 445 1 445 1 513 1 581 0.0
Alfred Nzo District Municipality 113 684 141 036 141 036 173 321 173 321 173 321 173 321 155 786 163 264 0.0
Unallocated 1 328 903 897 404 1 520 170 1 136 515 1 781 882 1 919 836 1 658 627 1 335 281 1 326 510 (13.6)
Table 8 above depicts the summary of departmental payments and budget estimates by benefiting
municipal boundary from 2019/20 to 2025/26. Expenditure in the municipalities is for the construction of
priority roads, roads maintenance projects as well as subsidies to Algoa Bus Company, Africa’s Best
(AB350), Mayibuye Transport Corporation (MTC) and scholar transport.
538