
Page 607 - Provincial Treasury Estimates.pdf
P. 607
Estimates of the Provincial Revenue and Expenditure (EPRE) – 2023/24 Financial Year
9. Other programme information
9.1 Personnel numbers and costs
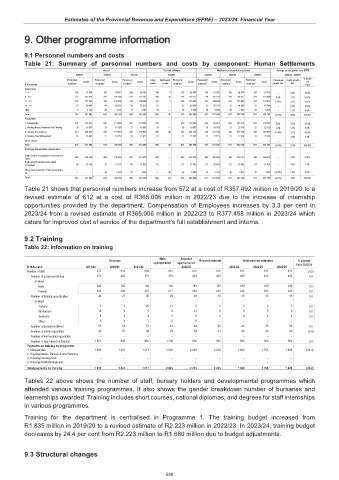
Table 21: Summary of personnel numbers and costs by component: Human Settlements
Actual Revised estimate Medium-term expenditure estimate Average annual growth over MTEF
2019/20 2020/21 2021/22 2022/23 2023/24 2024/25 2025/26 2022/23 - 2025/26
Personnel Costs Personnel Costs Personnel Costs Filled Additional Personnel Costs Personnel Costs Personnel Costs Personnel Costs Personnel Costs growth % Costs
of
R thousands numbers 1 numbers 1 numbers 1 posts posts numbers 1 numbers 1 numbers 1 numbers 1 growth rate rate Total
Salary level
1 – 7 155 11 803 158 39 511 156 48 167 149 6 155 48 979 155 51 782 155 54 570 155 57 315 – 5.4% 13.9%
8 – 10 227 147 429 228 106 286 226 115 267 190 36 226 126 317 229 135 123 229 134 817 229 141 009 0.4% 3.7% 34.7%
11 – 12 129 127 509 136 127 098 134 108 509 131 4 135 125 694 131 128 926 131 135 092 131 134 074 (-1%) 2.2% 34.1%
13 – 16 52 66 495 49 63 532 49 67 818 51 – 51 60 930 51 58 102 51 64 596 51 65 588 – 2.5% 16.5%
Other 9 4 256 39 3 727 44 3 494 45 – 45 3 088 45 3 525 45 3 631 45 3 795 – 7.1% 0.9%
Total 572 357 492 610 340 154 609 343 255 566 46 612 365 006 611 377 458 611 392 706 611 401 781 (-0.1%) 3.3% 100.0%
Programme
1. Administration 207 116 347 220 111 890 221 114 695 219 – 219 119 409 224 118 017 222 128 174 222 130 367 0.5% 3.0% 32.6%
2. Housing Needs, Research And Planning 26 18 533 29 17 993 27 18 967 30 – 30 19 807 30 20 570 32 22 138 32 23 133 2.2% 5.3% 5.6%
3. Housing Development 321 204 009 340 191 019 343 197 672 286 46 332 204 754 326 217 156 326 219 784 326 224 657 (-0.6%) 3.1% 56.0%
4. Housing Asset Management 18 18 603 21 19 252 18 11 921 31 – 31 21 037 31 21 715 31 22 610 31 23 624 – 3.9% 5.8%
Direct charges – – – – – – – – – – – – – – – – – – –
Total 572 357 492 610 340 154 609 343 255 566 46 612 365 006 611 377 458 611 392 706 611 401 781 (-0.1%) 3.3% 100.0%
Employee dispensation classification
Public Service Act appointees not covered by
OSDs 486 334 350 499 315 903 447 312 675 449 – 449 333 870 449 345 543 449 359 117 449 366 685 – 3.2% 91.4%
Engineering Professions and related
occupations 86 23 142 72 21 731 118 27 921 117 – 117 27 851 117 28 581 117 30 255 117 31 614 – 4.3% 7.7%
Others such as interns, EPWP, learnerships,
etc – – 39 2 520 44 2 659 – 46 46 3 285 45 3 334 45 3 334 45 3 482 (-0.7%) 2.0% 0.9%
Total 572 357 492 610 340 154 609 343 255 566 46 612 365 006 611 377 458 611 392 706 611 401 781 (-0.1%) 3.3% 100.0%
Table 21 shows that personnel numbers increase from 572 at a cost of R357.492 million in 2019/20 to a
revised estimate of 612 at a cost of R365.006 million in 2022/23 due to the increase of internship
opportunities provided by the department. Compensation of Employees increases by 3.3 per cent in
2023/24 from a revised estimate of R365.006 million in 2022/23 to R377.458 million in 2023/24 which
caters for improved cost of service of the department’s full establishment and interns.
9.2 Training
Table 22: Information on training
Main Adjusted
Outcome Revised estimate Medium-term estimates % change
appropriation appropriation
R thousand 2019/20 2020/21 2021/22 2022/23 2023/24 2024/25 2025/26 from 2022/23
Number of staff 572 610 609 612 612 612 611 611 611 (0.2)
Number of personnel trained 570 423 370 379 423 423 423 423 423 0.0
of which
Male 244 183 143 162 183 183 183 183 183 0.0
Female 326 240 227 217 240 240 240 240 240 0.0
Number of training opportunities 34 27 36 29 29 15 15 15 15 0.0
of which
Tertiary 9 3 20 11 2 2 2 2 2 0.0
Workshops 12 9 5 9 12 9 9 9 9 0.0
Seminars 8 9 4 7 9 4 4 4 4 0.0
Other 5 6 7 2 6 – – – –
Number of bursaries offered 55 54 51 44 44 45 45 45 45 0.0
Number of interns appointed 45 47 34 29 29 41 40 40 40 (2.4)
Number of learnerships appointed – – – – – – – – –
Number of days spent on training 1 251 800 950 1 100 900 900 900 900 900 0.0
Payments on training by programme
1. Administration 1 835 1 447 1 017 2 823 2 223 2 223 1 680 1 755 1 800 (24.4)
2. Housing Needs, Research And Planning – – – – – – – – –
3. Housing Development – – – – – – – – –
4. Housing Asset Management – – – – – – – – –
Total payments on training 1 835 1 447 1 017 2 823 2 223 2 223 1 680 1 755 1 800 (24.4)
Tables 22 above shows the number of staff, bursary holders and developmental programmes which
attended various training programmes. It also shows the gender breakdown number of bursaries and
learnerships awarded. Training includes short courses, national diplomas, and degrees for staff internships
in various programmes.
Training for the department is centralised in Programme 1. The training budget increased from
R1.835 million in 2019/20 to a revised estimate of R2.223 million in 2022/23. In 2023/24, training budget
decreases by 24.4 per cent from R2.223 million to R1.680 million due to budget adjustments.
9.3 Structural changes
590