
Page 713 - Provincial Treasury Estimates.pdf
P. 713
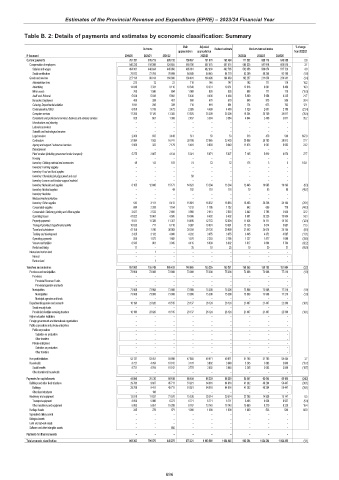
Estimates of the Provincial Revenue and Expenditure (EPRE) – 2023/24 Financial Year
Table B. 2: Details of payments and estimates by economic classification: Summary
Main Adjusted % change
Outcome Revised estimate Medium-term estimates
appropriation appropriation from 2022/23
R thousand 2019/20 2020/21 2021/22 2022/23 2023/24 2024/25 2025/26
Current payments 767 351 619 213 685 735 758 107 761 971 762 464 777 582 809 776 840 259 2.0
Compensation of employees 540 233 519 398 524 855 569 706 567 475 567 475 585 325 597 918 609 918 3.1
Salaries and wages 464 361 446 634 445 956 485 061 482 830 482 705 502 056 509 674 517 720 4.0
Social contributions 75 872 72 764 78 899 84 645 84 645 84 770 83 269 88 244 92 198 (1.8)
Goods and services 227 118 99 814 160 880 188 401 194 496 194 989 192 257 211 858 230 341 (1.4)
Administrative fees 215 12 21 118 146 147 162 111 116 10.2
Advertising 14 840 3 331 8 116 10 340 10 331 10 331 12 016 9 061 9 468 16.3
Minor assets 769 1 586 694 1 089 826 826 698 171 178 (15.5)
Audit cost: External 5 628 5 038 5 882 5 436 4 436 4 436 5 400 5 958 6 225 21.7
Bursaries: Employees 489 399 457 600 670 679 940 915 956 38.4
Catering: Departmental activities 1 041 298 339 710 661 661 774 673 702 17.1
Communication (G&S) 6 058 5 319 3 472 2 926 4 489 4 489 3 529 2 631 2 788 (21.4)
Computer services 17 286 12 120 13 365 13 825 25 309 25 309 16 354 25 769 34 817 (35.4)
Consultants and professional services: Business and advisory services 929 661 1 368 2 457 3 584 3 584 4 844 2 460 3 811 35.2
Infrastructure and planning – – – – – – – – –
Laboratory services – – – – – – – – –
Scientific and technological services – – – – – – – – –
Legal services 2 309 655 3 449 513 53 53 513 479 500 867.9
Contractors 31 984 7 583 16 741 30 788 22 865 23 429 29 908 39 783 38 913 27.7
Agency and support / outsourced services 5 909 322 7 179 5 481 9 603 9 640 11 875 9 507 9 932 23.2
Entertainment – – – – – – – – –
Fleet services (including government motor transport) 5 275 2 867 4 134 5 021 5 671 5 627 7 185 5 810 6 070 27.7
Housing – – – – – – – – –
Inventory: Clothing material and accessories 49 113 183 74 72 72 175 5 5 143.1
Inventory: Farming supplies – – – – – – – – –
Inventory: Food and food supplies – – – – – – – – –
Inventory: Chemicals,fuel,oil,gas,wood and coal – – – 50 – – – – –
Inventory: Learner and teacher support material – – – – – – – – –
Inventory: Materials and supplies 8 165 12 606 15 173 14 823 13 284 13 284 12 443 16 095 16 393 (6.3)
Inventory: Medical supplies – – 49 192 118 118 70 85 89 (40.7)
Inventory: Medicine – – – – – – – – –
Medsas inventory interface – – – – – – – – –
Inventory: Other supplies 542 3 111 8 412 15 801 16 932 16 855 13 463 20 256 24 164 (20.1)
Consumable supplies 654 2 285 1 164 1 313 1 155 1 152 642 686 715 (44.3)
Consumable: Stationery,printing and office supplies 3 627 2 533 2 600 3 958 2 613 2 603 3 442 2 795 2 920 32.2
Operating leases 41 822 13 961 4 595 19 006 6 402 6 402 8 601 15 226 15 804 34.3
Property payments 9 811 11 326 11 357 14 496 12 772 12 604 11 036 14 111 14 743 (12.4)
Transport provided: Departmental activity 10 635 717 6 710 9 097 10 001 10 001 12 136 5 614 5 867 21.3
Travel and subsistence 47 158 7 786 36 083 20 259 29 726 29 990 27 452 24 074 25 154 (8.5)
Training and development 2 425 3 132 4 800 4 202 3 875 3 875 3 445 4 372 4 567 (11.1)
Operating payments 936 1 072 1 492 1 376 2 253 2 195 1 327 1 577 1 649 (39.5)
Venues and facilities 8 545 981 3 045 4 415 6 639 6 602 3 817 3 604 3 764 (42.2)
Rental and hiring 17 – – 35 10 25 10 30 31 (60.0)
Interest and rent on land – 1 – – – – – – –
Interest – – – – – – – – –
Rent on land – 1 – – – – – – –
Transfers and subsidies 151 962 155 743 185 433 148 665 155 205 155 251 150 355 150 793 157 884 (3.2)
Provinces and municipalities 73 908 73 908 73 908 73 908 75 308 75 308 73 908 73 908 77 216 (1.9)
Provinces – – – – – – – – –
Provincial Revenue Funds – – – – – – – – –
Provincial agencies and funds – – – – – – – – –
Municipalities 73 908 73 908 73 908 73 908 75 308 75 308 73 908 73 908 77 216 (1.9)
Municipalities 73 908 73 908 73 908 73 908 75 308 75 308 73 908 73 908 77 216 (1.9)
Municipal agencies and funds – – – – – – – – –
Departmental agencies and accounts 16 196 23 620 41 515 23 137 26 124 26 124 21 407 21 407 22 366 (18.1)
Social security funds – – – – – – – – –
Provide list of entities receiving transfers 16 196 23 620 41 515 23 137 26 124 26 124 21 407 21 407 22 366 (18.1)
Higher education institutions – – – – – – – – –
Foreign governments and international organisations – – – – – – – – –
Public corporations and private enterprises – – – – – – – – –
Public corporations – – – – – – – – –
Subsidies on production – – – – – – – – –
Other transfers – – – – – – – – –
Private enterprises – – – – – – – – –
Subsidies on production – – – – – – – – –
Other transfers – – – – – – – – –
Non-profit institutions 53 137 53 451 59 998 47 850 49 971 49 971 51 795 51 795 54 454 3.7
Households 8 721 4 764 10 012 3 770 3 802 3 848 3 245 3 683 3 848 (15.7)
Social benefits 8 721 4 764 10 012 3 770 3 802 3 848 3 245 3 683 3 848 (15.7)
Other transfers to households – – – – – – – – –
Payments for capital assets 44 050 21 720 69 108 68 459 86 330 86 330 65 457 63 645 66 140 (24.2)
Buildings and other fixed structures 29 786 9 607 45 711 51 921 64 816 64 816 41 392 48 284 50 447 (36.1)
Buildings 29 786 9 411 45 711 51 921 64 816 64 816 41 392 48 284 50 447 (36.1)
Other fixed structures – 196 – – – – – – –
Machinery and equipment 13 919 11 837 21 570 15 538 20 514 20 514 22 265 14 838 15 147 8.5
Transport equipment 8 856 5 986 6 272 6 771 6 771 6 771 6 405 6 628 6 927 (5.4)
Other machinery and equipment 5 063 5 851 15 298 8 767 13 743 13 743 15 860 8 210 8 220 15.4
Heritage Assets 345 276 971 1 000 1 000 1 000 1 800 523 546 80.0
Specialised military assets – – – – – – – – –
Biological assets – – – – – – – – –
Land and sub-soil assets – – – – – – – – –
Software and other intangible assets – – 856 – – – – – –
Payments for financial assets – – – – – – – – –
Total economic classification 963 363 796 676 940 276 975 231 1 003 506 1 004 045 993 394 1 024 214 1 064 283 (1.1)
696