
Page 716 - Provincial Treasury Estimates.pdf
P. 716
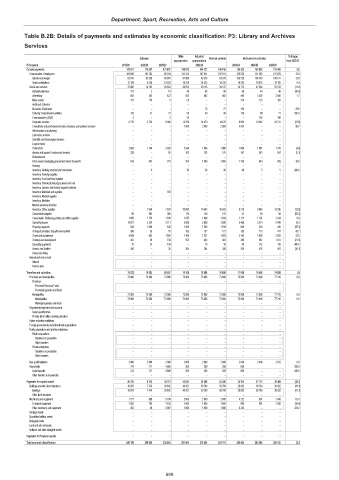
Department: Sport, Recreation, Arts and Culture
Table B.2B: Details of payments and estimates by economic classification: P3: Library and Archives
Services
Main Adjusted % change
Outcome Revised estimate Medium-term estimates
appropriation appropriation from 2022/23
R thousand 2019/20 2020/21 2021/22 2022/23 2023/24 2024/25 2025/26
Current payments 142 811 115 897 121 857 148 675 146 727 146 748 155 303 168 905 176 469 5.8
Compensation of employees 104 945 101 762 95 204 112 123 107 611 107 611 120 530 121 245 123 676 12.0
Salaries and wages 92 816 92 538 80 976 97 888 93 376 93 376 106 238 106 730 108 511 13.8
Social contributions 12 129 9 224 14 228 14 235 14 235 14 235 14 292 14 515 15 165 0.4
Goods and services 37 866 14 135 26 653 36 552 39 116 39 137 34 773 47 660 52 793 (11.2)
Administrative fees 137 2 14 48 98 98 58 44 46 (40.8)
Advertising 858 542 422 502 482 482 490 3 292 3 440 1.7
Minor assets 131 174 3 20 – – 310 123 128
Audit cost: External – – – – – – – – –
Bursaries: Employees – – – – 70 77 100 – – 29.9
Catering: Departmental activities 142 31 73 50 40 40 158 68 71 295.0
Communication (G&S) 2 – 2 30 – – – 102 106
Computer services 6 770 2 762 8 040 13 700 14 470 14 470 9 000 19 842 20 731 (37.8)
Consultants and professional services: Business and advisory services – – – 1 500 2 000 2 000 3 933 – – 96.7
Infrastructure and planning – – – – – – – – –
Laboratory services – – – – – – – – –
Scientific and technological services – – – – – – – – –
Legal services – – – – – – – – –
Contractors 2 668 1 164 2 029 2 546 1 986 1 986 1 888 1 681 1 756 (4.9)
Agency and support / outsourced services 328 – 95 163 183 176 167 543 567 (5.1)
Entertainment – – – – – – – – –
Fleet services (including government motor transport) 584 401 701 350 1 000 1 000 1 100 844 882 10.0
Housing – – – – – – – – –
Inventory: Clothing material and accessories – 8 – 30 30 30 90 5 5 200.0
Inventory: Farming supplies – – – – – – – – –
Inventory: Food and food supplies – – – – – – – – –
Inventory: Chemicals,fuel,oil,gas,wood and coal – – – – – – – – –
Inventory: Learner and teacher support material – – – – – – – – –
Inventory: Materials and supplies – – 100 – – – – – –
Inventory: Medical supplies – – – – – – – – –
Inventory: Medicine – – – – – – – – –
Medsas inventory interface – – – – – – – – –
Inventory: Other supplies – 1 936 7 320 10 000 10 543 10 543 9 219 9 949 13 395 (12.6)
Consumable supplies 89 983 266 170 150 147 51 94 98 (65.3)
Consumable: Stationery,printing and office supplies 1 050 1 179 1 100 1 075 1 049 1 039 1 111 1 191 1 244 6.9
Operating leases 18 827 3 324 3 111 3 000 3 000 3 000 3 460 5 214 5 448 15.3
Property payments 538 1 086 838 1 260 1 580 1 516 680 393 410 (55.1)
Transport provided: Departmental activity 388 30 76 105 127 127 185 715 747 45.7
Travel and subsistence 4 509 452 1 550 1 166 1 531 1 605 2 143 1 965 2 053 33.5
Training and development 407 28 739 553 483 483 380 987 1 031 (21.3)
Operating payments 72 33 139 – 10 10 50 132 138 400.0
Venues and facilities 366 – 35 284 284 308 200 476 497 (35.1)
Rental and hiring – – – – – – – – –
Interest and rent on land – – – – – – – – –
Interest – – – – – – – – –
Rent on land – – – – – – – – –
Transfers and subsidies 76 632 76 625 80 597 76 108 76 608 76 608 77 008 76 408 79 828 0.5
Provinces and municipalities 73 908 73 908 73 908 73 908 73 908 73 908 73 908 73 908 77 216 0.0
Provinces – – – – – – – – –
Provincial Revenue Funds – – – – – – – – –
Provincial agencies and funds – – – – – – – – –
Municipalities 73 908 73 908 73 908 73 908 73 908 73 908 73 908 73 908 77 216 0.0
Municipalities 73 908 73 908 73 908 73 908 73 908 73 908 73 908 73 908 77 216 0.0
Municipal agencies and funds – – – – – – – – –
Departmental agencies and accounts – – – – – – – – –
Social security funds – – – – – – – – –
Provide list of entities receiving transfers – – – – – – – – –
Higher education institutions – – – – – – – – –
Foreign governments and international organisations – – – – – – – – –
Public corporations and private enterprises – – – – – – – – –
Public corporations – – – – – – – – –
Subsidies on production – – – – – – – – –
Other transfers – – – – – – – – –
Private enterprises – – – – – – – – –
Subsidies on production – – – – – – – – –
Other transfers – – – – – – – – –
Non-profit institutions 2 000 2 000 2 000 2 000 2 500 2 500 2 500 2 500 2 612 0.0
Households 724 717 4 689 200 200 200 600 – – 200.0
Social benefits 724 717 4 689 200 200 200 600 – – 200.0
Other transfers to households – – – – – – – – –
Payments for capital assets 20 755 8 312 35 751 43 021 53 360 53 360 34 114 37 775 39 468 (36.1)
Buildings and other fixed structures 18 978 7 474 30 642 40 421 50 760 50 760 29 892 36 784 38 432 (41.1)
Buildings 18 978 7 474 30 642 40 421 50 760 50 760 29 892 36 784 38 432 (41.1)
Other fixed structures – – – – – – – – –
Machinery and equipment 1 777 838 5 109 2 600 2 600 2 600 4 222 991 1 036 62.4
Transport equipment 1 425 780 1 102 1 600 1 600 1 600 980 991 1 036 (38.8)
Other machinery and equipment 352 58 4 007 1 000 1 000 1 000 3 242 – – 224.2
Heritage Assets – – – – – – – – –
Specialised military assets – – – – – – – – –
Biological assets – – – – – – – – –
Land and sub-soil assets – – – – – – – – –
Software and other intangible assets – – – – – – – – –
Payments for financial assets – – – – – – – – –
Total economic classification 240 198 200 834 238 205 267 804 276 695 276 716 266 425 283 088 295 765 (3.7)
699