
Page 715 - Provincial Treasury Estimates.pdf
P. 715
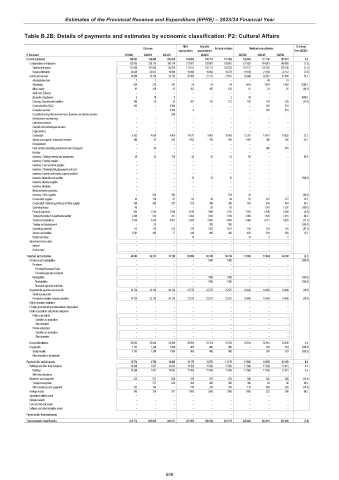
Estimates of the Provincial Revenue and Expenditure (EPRE) – 2023/24 Financial Year
Table B.2B: Details of payments and estimates by economic classification: P2: Cultural Affairs
Main Adjusted % change
Outcome Revised estimate Medium-term estimates
appropriation appropriation from 2022/23
R thousand 2019/20 2020/21 2021/22 2022/23 2023/24 2024/25 2025/26
Current payments 152 893 138 843 150 846 163 889 160 913 161 452 162 869 177 746 185 910 0.9
Compensation of employees 132 033 128 114 130 714 137 501 139 801 139 801 137 923 144 919 148 860 (1.3)
Salaries and wages 111 608 107 593 110 820 117 811 120 111 120 023 118 727 123 755 126 748 (1.1)
Social contributions 20 425 20 521 19 894 19 690 19 690 19 778 19 196 21 164 22 112 (2.9)
Goods and services 20 860 10 729 20 132 26 388 21 112 21 651 24 946 32 827 37 050 15.2
Administrative fees 1 1 – – – – – 49 51
Advertising 854 273 347 54 54 54 1 456 1 974 2 063 2596.3
Minor assets 91 339 53 153 102 102 55 24 25 (46.1)
Audit cost: External – – – – – – – – –
Bursaries: Employees 2 19 5 – – 2 40 – – 1900.0
Catering: Departmental activities 190 24 33 207 122 122 105 314 328 (13.9)
Communication (G&S) 243 – 3 000 – – – – 502 524
Computer services – – 3 500 4 – – – 392 410
Consultants and professional services: Business and advisory services – – 299 – – – – – –
Infrastructure and planning – – – – – – – – –
Laboratory services – – – – – – – – –
Scientific and technological services – – – – – – – – –
Legal services – – – – – – – – –
Contractors 5 432 4 658 4 966 14 577 9 487 10 043 12 381 13 479 16 835 23.3
Agency and support / outsourced services 480 97 282 1 052 700 700 1 002 280 292 43.1
Entertainment – – – – – – – – –
Fleet services (including government motor transport) – 64 – – – – – 646 675
Housing – – – – – – – – –
Inventory: Clothing material and accessories 49 52 128 44 42 42 80 – – 90.5
Inventory: Farming supplies – – – – – – – – –
Inventory: Food and food supplies – – – – – – – – –
Inventory: Chemicals,fuel,oil,gas,wood and coal – – – – – – – – –
Inventory: Learner and teacher support material – – – – – – – – –
Inventory: Materials and supplies – – – 10 10 10 – – – (100.0)
Inventory: Medical supplies – – – – – – – – –
Inventory: Medicine – – – – – – – – –
Medsas inventory interface – – – – – – – – –
Inventory: Other supplies – 594 393 – – 104 20 – – (80.8)
Consumable supplies 82 138 97 64 49 49 56 261 272 14.3
Consumable: Stationery,printing and office supplies 269 383 237 515 390 390 533 435 454 36.7
Operating leases 40 – – – 50 50 – 1 241 1 297 (100.0)
Property payments 954 1 244 1 040 3 879 1 806 1 702 1 553 5 349 5 589 (8.8)
Transport provided: Departmental activity 2 340 232 411 2 364 1 810 1 810 2 969 1 545 1 615 64.0
Travel and subsistence 7 630 2 020 4 851 2 845 4 565 4 650 4 086 4 713 4 925 (12.1)
Training and development – 25 – – 200 200 – – – (100.0)
Operating payments 112 110 413 370 1 325 1 221 150 703 735 (87.7)
Venues and facilities 2 091 456 77 240 400 400 450 918 958 12.5
Rental and hiring – – – 10 – – 10 2 2
Interest and rent on land – – – – – – – – –
Interest – – – – – – – – –
Rent on land – – – – – – – – –
Transfers and subsidies 49 305 59 213 76 122 50 899 56 749 56 749 51 559 51 864 54 189 (9.1)
Provinces and municipalities – – – – 1 400 1 400 – – – (100.0)
Provinces – – – – – – – – –
Provincial Revenue Funds – – – – – – – – –
Provincial agencies and funds – – – – – – – – –
Municipalities – – – – 1 400 1 400 – – – (100.0)
Municipalities – – – – 1 400 1 400 – – – (100.0)
Municipal agencies and funds – – – – – – – – –
Departmental agencies and accounts 14 720 22 120 40 120 21 575 23 575 23 575 18 645 18 645 19 480 (20.9)
Social security funds – – – – – – – – –
Provide list of entities receiving transfers 14 720 22 120 40 120 21 575 23 575 23 575 18 645 18 645 19 480 (20.9)
Higher education institutions – – – – – – – – –
Foreign governments and international organisations – – – – – – – – –
Public corporations and private enterprises – – – – – – – – –
Public corporations – – – – – – – – –
Subsidies on production – – – – – – – – –
Other transfers – – – – – – – – –
Private enterprises – – – – – – – – –
Subsidies on production – – – – – – – – –
Other transfers – – – – – – – – –
Non-profit institutions 32 832 35 844 34 498 28 924 31 374 31 374 32 914 32 914 34 390 4.9
Households 1 753 1 249 1 504 400 400 400 – 305 319 (100.0)
Social benefits 1 753 1 249 1 504 400 400 400 – 305 319 (100.0)
Other transfers to households – – – – – – – – –
Payments for capital assets 10 974 2 784 16 449 13 170 13 170 13 170 13 800 12 605 13 169 4.8
Buildings and other fixed structures 10 306 1 937 14 842 11 500 11 500 11 500 11 500 11 500 12 015 0.0
Buildings 10 306 1 937 14 842 11 500 11 500 11 500 11 500 11 500 12 015 0.0
Other fixed structures – – – – – – – – –
Machinery and equipment 323 571 636 670 670 670 500 582 608 (25.4)
Transport equipment – 377 636 300 300 300 390 84 88 30.0
Other machinery and equipment 323 194 – 370 370 370 110 498 520 (70.3)
Heritage Assets 345 276 971 1 000 1 000 1 000 1 800 523 546 80.0
Specialised military assets – – – – – – – – –
Biological assets – – – – – – – – –
Land and sub-soil assets – – – – – – – – –
Software and other intangible assets – – – – – – – – –
Payments for financial assets – – – – – – – – –
Total economic classification 213 172 200 840 243 417 227 958 230 832 231 371 228 228 242 215 253 268 (1.4)
698