
Page 714 - Provincial Treasury Estimates.pdf
P. 714
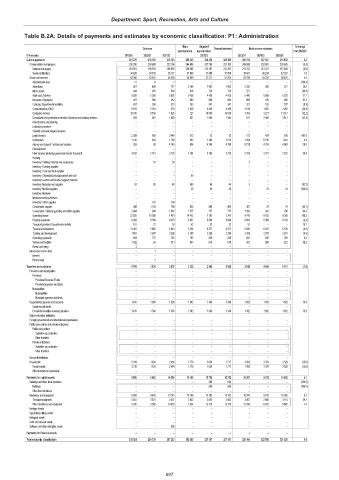
Department: Sport, Recreation, Arts and Culture
Table B.2A: Details of payments and estimates by economic classification: P1: Administration
Main Adjusted % change
Outcome Revised estimate Medium-term estimates
appropriation appropriation from 2022/23
R thousand 2019/20 2020/21 2021/22 2022/23 2023/24 2024/25 2025/26
Current payments 318 370 278 193 278 725 299 445 308 436 308 369 309 755 307 937 316 163 0.4
Compensation of employees 236 290 224 689 232 166 244 486 251 165 251 165 249 999 253 561 255 685 (0.5)
Salaries and wages 201 651 190 354 196 989 206 488 213 167 213 167 211 332 213 327 213 648 (0.9)
Social contributions 34 639 34 335 35 177 37 998 37 998 37 998 38 667 40 234 42 037 1.8
Goods and services 82 080 53 503 46 559 54 959 57 271 57 204 59 756 54 376 60 478 4.5
Administrative fees 71 9 7 – – 1 – – – (100.0)
Advertising 867 468 717 2 148 1 902 1 902 2 292 208 217 20.5
Minor assets 494 976 638 916 724 724 221 – – (69.5)
Audit cost: External 5 628 5 038 5 882 5 436 4 436 4 436 5 400 5 958 6 225 21.7
Bursaries: Employees 487 380 452 600 600 600 800 915 956 33.3
Catering: Departmental activities 637 204 231 283 341 341 321 103 107 (5.9)
Communication (G&S) 5 813 5 319 470 2 836 4 429 4 429 3 519 1 925 2 052 (20.5)
Computer services 10 516 9 358 1 825 121 10 839 10 839 7 354 3 277 11 317 (32.2)
Consultants and professional services: Business and advisory services 929 661 1 069 957 1 584 1 584 911 2 460 3 811 (42.5)
Infrastructure and planning – – – – – – – – –
Laboratory services – – – – – – – – –
Scientific and technological services – – – – – – – – –
Legal services 2 309 655 3 449 513 53 53 513 479 500 867.9
Contractors 1 126 659 1 760 853 1 283 1 215 1 268 6 745 1 643 4.4
Agency and support / outsourced services 353 36 4 145 834 4 746 4 790 6 218 4 750 4 963 29.8
Entertainment – – – – – – – – –
Fleet services (including government motor transport) 4 182 2 114 2 729 3 764 3 764 3 720 5 535 3 371 3 522 48.8
Housing – – – – – – – – –
Inventory: Clothing material and accessories – 53 55 – – – 5 – –
Inventory: Farming supplies – – – – – – – – –
Inventory: Food and food supplies – – – – – – – – –
Inventory: Chemicals,fuel,oil,gas,wood and coal – – – 50 – – – – –
Inventory: Learner and teacher support material – – – – – – – – –
Inventory: Materials and supplies 62 83 40 560 64 64 5 – – (92.2)
Inventory: Medical supplies – – – 20 30 30 – 22 23 (100.0)
Inventory: Medicine – – – – – – – – –
Medsas inventory interface – – – – – – – – –
Inventory: Other supplies – 124 104 – – – – – –
Consumable supplies 388 1 130 768 825 800 800 367 76 79 (54.1)
Consumable: Stationery,printing and office supplies 2 004 909 1 067 1 517 717 717 1 393 282 295 94.3
Operating leases 22 820 10 589 1 461 14 412 1 761 1 761 4 741 6 192 6 365 169.2
Property payments 8 282 8 588 9 479 8 957 8 986 8 986 8 803 8 369 8 744 (2.0)
Transport provided: Departmental activity 101 27 16 42 32 32 57 – – 78.1
Travel and subsistence 11 401 2 665 6 481 5 254 6 377 6 377 5 945 6 437 6 726 (6.8)
Training and development 1 581 2 697 2 398 2 345 2 298 2 298 2 285 2 279 2 381 (0.6)
Operating payments 604 737 765 765 829 829 882 268 280 6.4
Venues and facilities 1 422 24 551 951 676 676 921 260 272 36.2
Rental and hiring 3 – – – – – – – –
Interest and rent on land – 1 – – – – – – –
Interest – – – – – – – – –
Rent on land – 1 – – – – – – –
Transfers and subsidies 6 795 3 134 3 879 3 332 2 999 3 066 3 012 4 940 5 161 (1.8)
Provinces and municipalities – – – – – – – – –
Provinces – – – – – – – – –
Provincial Revenue Funds – – – – – – – – –
Provincial agencies and funds – – – – – – – – –
Municipalities – – – – – – – – –
Municipalities – – – – – – – – –
Municipal agencies and funds – – – – – – – – –
Departmental agencies and accounts 1 476 1 500 1 395 1 562 1 349 1 349 1 562 1 562 1 632 15.8
Social security funds – – – – – – – – –
Provide list of entities receiving transfers 1 476 1 500 1 395 1 562 1 349 1 349 1 562 1 562 1 632 15.8
Higher education institutions – – – – – – – – –
Foreign governments and international organisations – – – – – – – – –
Public corporations and private enterprises – – – – – – – – –
Public corporations – – – – – – – – –
Subsidies on production – – – – – – – – –
Other transfers – – – – – – – – –
Private enterprises – – – – – – – – –
Subsidies on production – – – – – – – – –
Other transfers – – – – – – – – –
Non-profit institutions – – – – – – – – –
Households 5 319 1 634 2 484 1 770 1 650 1 717 1 450 3 378 3 529 (15.6)
Social benefits 5 319 1 634 2 484 1 770 1 650 1 717 1 450 3 378 3 529 (15.6)
Other transfers to households – – – – – – – – –
Payments for capital assets 9 856 9 403 14 599 10 186 15 752 15 752 16 397 9 912 10 002 4.1
Buildings and other fixed structures – – – – 590 590 – – – (100.0)
Buildings – – – – 590 590 – – – (100.0)
Other fixed structures – – – – – – – – –
Machinery and equipment 9 856 9 403 13 743 10 186 15 162 15 162 16 397 9 912 10 002 8.1
Transport equipment 5 551 3 821 2 927 2 852 2 852 2 852 3 967 2 980 3 115 39.1
Other machinery and equipment 4 305 5 582 10 816 7 334 12 310 12 310 12 430 6 932 6 887 1.0
Heritage Assets – – – – – – – – –
Specialised military assets – – – – – – – – –
Biological assets – – – – – – – – –
Land and sub-soil assets – – – – – – – – –
Software and other intangible assets – – 856 – – – – – –
Payments for financial assets – – – – – – – – –
Total economic classification 335 021 290 730 297 203 312 963 327 187 327 187 329 164 322 789 331 326 0.6
697