
Page 718 - Provincial Treasury Estimates.pdf
P. 718
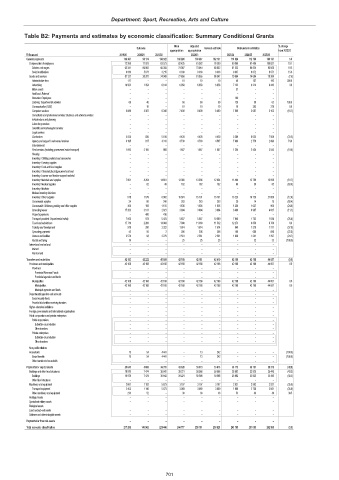
Department: Sport, Recreation, Arts and Culture

           Table B2: Payments and estimates by economic classification: Summary Conditional Grants

                                                                Main   Adjusted                      % change
                                                   Outcome                Revised estimate  Medium-term estimates
                                                              appropriation  appropriation           from 2022/23
            R thousand                       2019/20  2020/21  2021/22  2022/23   2023/24  2024/25  2025/26
            Current payments                               153 381  98 174                 138 522                 160 281                 163 337                 162 737                 170 824                 172 190                 180 131  5.0
             Compensation of employees        72 260  71 973  63 573  82 425  81 382  76 390  90 960  97 496                 100 827  19.1
              Salaries and wages              65 341  66 902  60 358  74 087  73 044  68 052  81 323  90 824  93 856  19.5
              Social contributions             6 919  5 071  3 215  8 338  8 338  8 338  9 637  6 672  6 971  15.6
             Goods and services                81 121  26 201  74 949  77 856  81 955  86 347  79 864  74 694    79 304  (7.5)
              Administrative fees              117     –     –     10    10    10     40   137      192  300.0
              Advertising                      10 502  1 354  6 614  6 858  6 858  6 858  7 122  6 214    6 443  3.8
              Minor assets                      –      –     –     –     –      –     37    –     –
              Audit cost: External              –      –     –     –     –      –     –     –     –
              Bursaries: Employees              –      –     –     –     –      –    100    –     –
              Catering: Departmental activities  69   40     –     60    60    60    120    59    62    100.0
              Communication (G&S)               –     10     –     10    10    10     10   363      379  0.0
              Computer services                5 886  3 387  6 340  7 400  8 400  8 400  7 000  2 607    3 153  (16.7)
              Consultants and professional services: Business and advisory services  –  –  –  –  –  –  –  –  –
              Infrastructure and planning       –      –     –     –     –      –     –     –     –
              Laboratory services               –      –     –     –     –      –     –     –     –
              Scientific and technological services  –  –    –     –     –      –     –     –     –
              Legal services                    –      –     –     –     –      –     –     –     –
              Contractors                      5 826  820  5 610  4 428  4 428  4 428  3 389  8 035    7 509  (23.5)
              Agency and support / outsourced services  4 195  817  4 313  4 738  4 738  4 567  7 984  2 770    2 894  74.8
              Entertainment                     –      –     –     –     –      –     –     –     –
              Fleet services (including government motor transport)  1 093  2 105  868  1 667  1 667  1 667  1 350  2 434    2 543  (19.0)
              Housing                           –      –     –     –     –      –     –     –     –
              Inventory: Clothing material and accessories  –  –  –  –   –      –     –     –     –
              Inventory: Farming supplies       –      –     –     –     –      –     –     –     –
              Inventory: Food and food supplies  –     –     –     –     –      –     –     –     –
              Inventory: Chemicals,fuel,oil,gas,wood and coal  –  –  –  –  –    –     –     –     –
              Inventory: Learner and teacher support material  –  –  –  –  –    –     –     –     –
              Inventory: Materials and supplies  7 001  8 264  14 651  13 366  13 366  12 834  11 464  12 799    13 599  (10.7)
              Inventory: Medical supplies       –     62    49    162    162   162    60    59    62    (63.0)
              Inventory: Medicine               –      –     –     –     –      –     –     –     –
              Medsas inventory interface        –      –     –     –     –      –     –     –     –
              Inventory: Other supplies        518   1 579  6 982  15 601  15 131  15 131  13 223  16 720    21 856  (12.6)
              Consumable supplies               24    80    240   263    263   263    28    14    15    (89.4)
              Consumable: Stationery,printing and office supplies  308  193  1 155  1 636  1 636  1 636  1 230  1 627    968  (24.8)
              Operating leases                 17 263  3 511  2 821  3 894  3 894  3 894  3 460  6 997    4 657  (11.1)
              Property payments                 –     400   416    –     –      –     –     –     –
              Transport provided: Departmental activity  7 055  973  5 423  5 657  5 657  10 589  7 946  1 752    1 830  (25.0)
              Travel and subsistence           17 719  2 263  14 864  7 800  11 369  11 532  12 273  8 850    9 739  6.4
              Training and development         919    200  2 322  1 514  1 514  1 514  940  1 318    1 377  (37.9)
              Operating payments                42    50     2    206    206   206   160   666      696  (22.3)
              Venues and facilities            2 570  93   2 279  2 561  2 561  2 561  1 928  1 241    1 297  (24.7)
              Rental and hiring                 14     –     –     25    25    25     –     32    33    (100.0)
             Interest and rent on land          –      –     –     –     –      –     –     –     –
              Interest                          –      –     –     –     –      –     –     –     –
              Rent on land                      –      –     –     –     –      –     –     –     –
            Transfers and subsidies            42 183  42 222  46 609  42 168  42 181  42 410  42 168  42 168    44 057  (0.6)
             Provinces and municipalities     42 168  42 168  42 168  42 168  42 168  42 168  42 168  42 168  44 057  0.0
              Provinces                         –      –     –     –     –      –     –     –     –
               Provincial Revenue Funds         –      –     –     –     –      –     –     –     –
               Provincial agencies and funds    –      –     –     –     –      –     –     –     –
              Municipalities                   42 168  42 168  42 168  42 168  42 168  42 168  42 168  42 168  44 057  0.0
               Municipalities                  42 168  42 168  42 168  42 168  42 168  42 168  42 168  42 168  44 057  0.0
               Municipal agencies and funds     –      –     –     –     –      –     –     –     –
             Departmental agencies and accounts  –     –     –     –     –      –     –     –     –
              Social security funds             –      –     –     –     –      –     –     –     –
              Provide list of entities receiving transfers  –  –  –  –   –      –     –     –     –
             Higher education institutions      –      –     –     –     –      –     –     –     –
             Foreign governments and international organisations  –  –  –  –  –  –    –     –     –
             Public corporations and private enterprises  –  –  –  –     –      –     –     –     –
              Public corporations               –      –     –     –     –      –     –     –     –
               Subsidies on production          –      –     –     –     –      –     –     –     –
               Other transfers                  –      –     –     –     –      –     –     –     –
              Private enterprises               –      –     –     –     –      –     –     –     –
               Subsidies on production          –      –     –     –     –      –     –     –     –
               Other transfers                  –      –     –     –     –      –     –     –     –
             Non-profit institutions
             Households                         15    54   4 441   –     13    242    –     –     –    (100.0)
              Social benefits                   15    54   4 441   –     13    242    –     –     –    (100.0)
              Other transfers to households     –      –     –     –     –      –     –     –     –
            Payments for capital assets       21 645  8 666  36 315  42 328  53 673  53 673  30 713  36 727    38 372  (42.8)
             Buildings and other fixed structures  18 978  7 474  30 642  39 221  50 566  50 566  28 692  33 925  35 445  (43.3)
              Buildings                        18 978  7 474  30 642  39 221  50 566  50 566  28 692  33 925  35 445  (43.3)
              Other fixed structures            –      –     –     –     –      –     –     –     –
             Machinery and equipment           2 667  1 192  5 673  3 107  3 107  3 107  2 021  2 802  2 927  (35.0)
              Transport equipment              2 453  1 140  5 673  3 069  3 069  3 069  1 968  2 758  2 881  (35.9)
              Other machinery and equipment    214    52     –     38    38    38     53    44    46    39.5
             Heritage Assets                    –      –     –     –     –      –     –     –     –
             Specialised military assets        –      –     –     –     –      –     –     –     –
             Biological assets                  –      –     –     –     –      –     –     –     –
             Land and sub-soil assets           –      –     –     –     –      –     –     –     –
             Software and other intangible assets  –   –     –     –     –      –     –     –     –
            Payments for financial assets       –      –     –     –     –      –     –     –     –
            Total economic classification                  217 209                 149 062                 221 446                 244 777                 259 191                 258 820                 243 705                 251 085                 262 560  (5.8)


                                                             701