
Page 745 - Provincial Treasury Estimates.pdf
P. 745
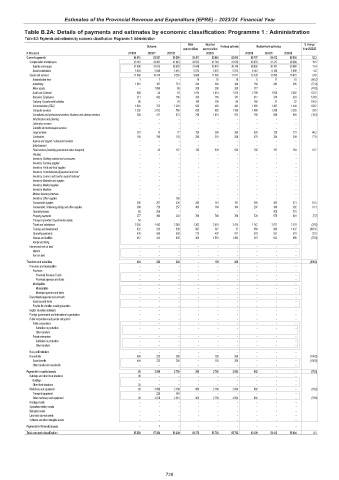
Estimates of the Provincial Revenue and Expenditure (EPRE) – 2023/24 Financial Year
Table B.2A: Details of payments and estimates by economic classification: Programme 1 : Administration
Table B.2: Payments and estimates by economic classification: Programme 1: Administration
Main Adjusted % change
Outcome Revised estimate Medium-term estimates
appropriation appropriation from 2022/23
R thousand 2019/20 2020/21 2021/22 2022/23 2023/24 2024/25 2025/26
Current payments 54 810 53 931 50 299 53 411 52 840 52 690 59 707 53 412 55 804 13.3
Compensation of employees 43 142 43 461 41 043 43 522 41 748 41 619 45 978 41 317 38 989 10.5
Salaries and wages 37 608 37 613 35 628 37 649 35 875 35 746 39 835 35 161 33 080 11.4
Social contributions 5 534 5 848 5 415 5 873 5 873 5 873 6 143 6 156 5 909 4.6
Goods and services 11 668 10 470 9 256 9 889 11 092 11 071 13 729 12 095 16 815 24.0
Administrative fees 1 1 – 10 18 18 6 17 18 (66.7)
Advertising 1 061 187 751 244 284 349 150 282 295 (57.0)
Minor assets – 1 090 58 200 200 200 117 – – (41.5)
Audit cost: External 988 24 10 1 474 1 074 1 074 2 709 1 639 3 802 152.2
Bursaries: Employees 211 832 155 323 155 141 317 310 324 124.8
Catering: Departmental activities 86 – 24 140 104 64 160 21 22 150.0
Communication (G&S) 1 624 752 1 326 582 482 482 1 365 1 387 1 449 183.2
Computer services 1 202 2 012 750 835 852 1 186 1 655 1 209 3 353 39.5
Consultants and professional services: Business and advisory services 200 471 573 756 1 014 972 795 856 894 (18.2)
Infrastructure and planning – – – – – – – – –
Laboratory services – – – – – – – – –
Scientific and technological services – – – – – – – – –
Legal services 201 13 77 130 265 265 520 125 131 96.2
Contractors 159 760 135 280 210 208 370 334 349 77.9
Agency and support / outsourced services – – – – – – – – –
Entertainment – – – – – – – – –
Fleet services (including government motor transport) – 42 137 133 533 533 702 157 164 31.7
Housing – – – – – – – – –
Inventory: Clothing material and accessories – – – – – – – – –
Inventory: Farming supplies – – – – – – – – –
Inventory: Food and food supplies – – – – – – – – –
Inventory: Chemicals,fuel,oil,gas,wood and coal – – – – – – – – –
Inventory: Learner and teacher support material – – – – – – – – –
Inventory: Materials and supplies – – – – – – – – –
Inventory: Medical supplies – – – – – – – – –
Inventory: Medicine – – – – – – – – –
Medsas inventory interface – – – – – – – – –
Inventory: Other supplies – – 156 – – – – – –
Consumable supplies 206 267 336 285 161 161 260 355 371 61.5
Consumable: Stationery,printing and office supplies 399 728 257 405 164 164 297 366 382 81.1
Operating leases 80 206 – – – – – 209 218
Property payments 277 493 233 780 780 780 720 575 601 (7.7)
Transport provided: Departmental activity 54 – – – – – – – –
Travel and subsistence 3 255 1 442 2 248 1 302 2 401 2 474 1 742 2 077 2 170 (29.6)
Training and development 822 323 536 997 347 37 950 993 1 037 2467.6
Operating payments 430 585 559 713 497 471 579 551 579 22.9
Venues and facilities 412 242 935 300 1 551 1 492 315 632 656 (78.9)
Rental and hiring – – – – – – – – –
Interest and rent on land – – – – – – – – –
Interest – – – – – – – – –
Rent on land – – – – – – – – –
Transfers and subsidies 404 223 200 – 193 268 – – – (100.0)
Provinces and municipalities – – – – – – – – –
Provinces – – – – – – – – –
Provincial Revenue Funds – – – – – – – – –
Provincial agencies and funds – – – – – – – – –
Municipalities – – – – – – – – –
Municipalities – – – – – – – – –
Municipal agencies and funds – – – – – – – – –
Departmental agencies and accounts – – – – – – – – –
Social security funds – – – – – – – – –
Provide list of entities receiving transfers – – – – – – – – –
Higher education institutions – – – – – – – – –
Foreign governments and international organisations – – – – – – – – –
Public corporations and private enterprises – – – – – – – – –
Public corporations – – – – – – – – –
Subsidies on production – – – – – – – – –
Other transfers – – – – – – – – –
Private enterprises – – – – – – – – –
Subsidies on production – – – – – – – – –
Other transfers – – – – – – – – –
Non-profit institutions – – – – – – – – –
Households 404 223 200 – 193 268 – – – (100.0)
Social benefits 404 223 200 – 193 268 – – – (100.0)
Other transfers to households – – – – – – – – –
Payments for capital assets 66 3 099 2 709 965 2 759 2 834 602 – – (78.8)
Buildings and other fixed structures 38 – – – – – – – –
Buildings – – – – – – – – –
Other fixed structures 38 – – – – – – – –
Machinery and equipment 28 3 099 2 709 965 2 759 2 834 602 – – (78.8)
Transport equipment – 220 148 – – – – – –
Other machinery and equipment 28 2 879 2 561 965 2 759 2 834 602 – – (78.8)
Heritage Assets – – – – – – – – –
Specialised military assets – – – – – – – – –
Biological assets – – – – – – – – –
Land and sub-soil assets – – – – – – – – –
Software and other intangible assets – – – – – – – – –
Payments for financial assets – 1 – – – – – – –
Total economic classification 55 280 57 254 53 208 54 376 55 792 55 792 60 309 53 412 55 804 8.1
728