
Page 744 - Provincial Treasury Estimates.pdf
P. 744
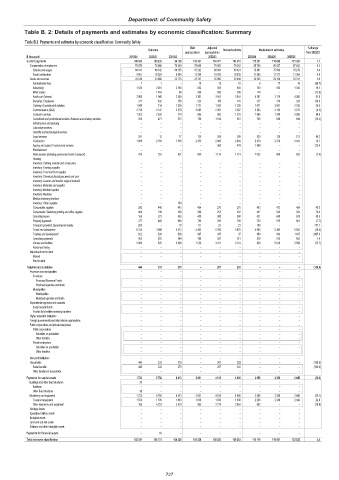
Department: of Community Safety
Table B. 2: Details of payments and estimates by economic classification: Summary
Table B.2: Payments and estimates by economic classification: Community Safety
Main Adjusted % change
Outcome Revised estimate Medium-term estimates
appropriation appropriation from 2022/23
R thousand 2019/20 2020/21 2021/22 2022/23 2023/24 2024/25 2025/26
Current payments 100 104 100 632 99 128 102 437 104 471 104 310 112 321 116 095 121 384 7.7
Compensation of employees 75 874 76 666 76 349 78 690 79 402 79 262 85 786 86 937 87 643 8.2
Salaries and wages 66 013 66 342 66 355 67 292 68 564 68 424 73 881 75 560 76 279 8.0
Social contributions 9 861 10 324 9 994 11 398 10 838 10 838 11 905 11 377 11 364 9.8
Goods and services 24 230 23 966 22 779 23 747 25 069 25 048 26 535 29 158 33 741 5.9
Administrative fees 1 1 – 10 18 18 6 17 18 (66.7)
Advertising 1 545 3 481 2 190 842 508 603 700 843 1 342 16.1
Minor assets – 1 454 88 200 200 200 176 – – (12.0)
Audit cost: External 2 960 1 966 2 504 3 361 3 041 3 041 4 287 2 179 4 366 41.0
Bursaries: Employees 211 832 155 323 155 141 317 310 324 124.8
Catering: Departmental activities 1 948 314 1 200 1 731 1 365 1 295 1 671 3 061 2 108 29.0
Communication (G&S) 2 728 2 147 2 570 2 682 2 387 2 387 2 383 3 135 3 275 (0.2)
Computer services 1 202 2 532 774 865 882 1 216 1 685 1 240 3 385 38.6
Consultants and professional services: Business and advisory services 200 471 573 756 1 014 972 795 856 894 (18.2)
Infrastructure and planning – – – – – – – – –
Laboratory services – – – – – – – – –
Scientific and technological services – – – – – – – – –
Legal services 201 13 77 130 265 265 520 125 131 96.2
Contractors 1 808 2 559 1 556 2 355 2 066 2 064 2 470 2 379 3 441 19.7
Agency and support / outsourced services – – – – 560 478 1 068 – – 123.4
Entertainment – – – – – – – – –
Fleet services (including government motor transport) 418 253 427 600 1 114 1 114 1 032 606 633 (7.4)
Housing – – – – – – – – –
Inventory: Clothing material and accessories – – – – – – – – –
Inventory: Farming supplies – – – – – – – – –
Inventory: Food and food supplies – – – – – – – – –
Inventory: Chemicals,fuel,oil,gas,wood and coal – – – – – – – – –
Inventory: Learner and teacher support material – – – – – – – – –
Inventory: Materials and supplies – – – – – – – – –
Inventory: Medical supplies – – – – – – – – –
Inventory: Medicine – – – – – – – – –
Medsas inventory interface – – – – – – – – –
Inventory: Other supplies – – 156 – – – – – –
Consumable supplies 242 446 443 404 270 270 403 473 494 49.3
Consumable: Stationery,printing and office supplies 460 749 258 500 252 252 437 502 524 73.4
Operating leases 153 279 433 400 300 300 421 649 678 40.3
Property payments 277 493 686 780 780 780 720 575 601 (7.7)
Transport provided: Departmental activity 205 – 18 111 21 21 180 – – 757.1
Travel and subsistence 6 314 3 988 5 472 4 402 5 766 5 870 4 905 5 385 6 082 (16.4)
Training and development 822 528 536 997 347 37 950 993 1 037 2467.6
Operating payments 455 635 564 768 597 571 579 812 852 1.4
Venues and facilities 2 080 825 2 099 1 530 3 161 3 153 830 5 018 3 556 (73.7)
Rental and hiring – – – – – – – – –
Interest and rent on land – – – – – – – – –
Interest – – – – – – – – –
Rent on land – – – – – – – – –
Transfers and subsidies 444 333 279 – 207 293 – – – (100.0)
Provinces and municipalities – – – – – – – – –
Provinces – – – – – – – – –
Provincial Revenue Funds – – – – – – – – –
Provincial agencies and funds – – – – – – – – –
Municipalities – – – – – – – – –
Municipalities – – – – – – – – –
Municipal agencies and funds – – – – – – – – –
Departmental agencies and accounts – – – – – – – – –
Social security funds – – – – – – – – –
Provide list of entities receiving transfers – – – – – – – – –
Higher education institutions – – – – – – – – –
Foreign governments and international organisations – – – – – – – – –
Public corporations and private enterprises – – – – – – – – –
Public corporations – – – – – – – – –
Subsidies on production – – – – – – – – –
Other transfers – – – – – – – – –
Private enterprises – – – – – – – – –
Subsidies on production – – – – – – – – –
Other transfers – – – – – – – – –
Non-profit institutions – – – – – – – – –
Households 444 333 279 – 207 293 – – – (100.0)
Social benefits 444 333 279 – 207 293 – – – (100.0)
Other transfers to households – – – – – – – – –
Payments for capital assets 1 763 5 758 4 813 2 801 4 615 4 690 2 858 2 386 2 448 (39.1)
Buildings and other fixed structures 38 – – – – – – – –
Buildings – – – – – – – – –
Other fixed structures 38 – – – – – – – –
Machinery and equipment 1 725 5 758 4 813 2 801 4 615 4 690 2 858 2 386 2 448 (39.1)
Transport equipment 1 556 1 535 1 803 1 836 1 836 1 836 2 256 2 386 2 448 22.9
Other machinery and equipment 169 4 223 3 010 965 2 779 2 854 602 – – (78.9)
Heritage Assets – – – – – – – – –
Specialised military assets – – – – – – – – –
Biological assets – – – – – – – – –
Land and sub-soil assets – – – – – – – – –
Software and other intangible assets – – – – – – – – –
Payments for financial assets – 51 – – – – – – –
Total economic classification 102 311 106 774 104 220 105 238 109 293 109 293 115 179 118 481 123 832 5.4
727