
Page 205 - Demo
P. 205
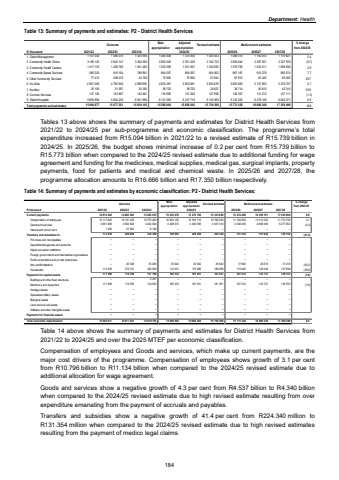
Department: HealthTable 13: Summary of payments and estimates: P2 - District Health Services Outcome Main appropriationAdjusted appropriation Revised estimate Medium-term estimates % change from 2024/25R thousand 2021/22 2022/23 2023/24 2025/26 2026/27 2027/281. District Management 1 084 075 1 107 030 1 035 993 1 080 408 1 074 930 1 030 453 1 086 510 1 150 410 1 179 821 5.42. Community Health Clinics 2 942 147 3 196 102 3 284 094 2 903 549 2 781 239 3 182 723 3 000 844 3 297 201 3 327 978 (5.7)3. Community Health Centres 1 409 766 1 417 103 1 541 482 1 533 299 1 531 947 1 534 925 1 579 790 1 633 211 1 698 596 2.94. Community Based Services 819 164 585 025 789 961 864 597 864 597 804 852 867 187 915 379 956 574 7.75. Other Community Services 208 015 77 412 54 756 75 956 75 956 67 843 87 972 81 420 85 005 29.76. Hiv/Aids 2 795 830 2 851 055 2 696 995 2 833 287 2 833 681 2 833 679 2 853 800 3 137 853 3 279 727 0.77. Nutrition 31 097 30 100 30 355 38 720 38 720 24 827 38 714 40 510 42 316 55.98. Coroner Services 132 897 137 156 142 661 116 596 121 256 127 958 126 307 131 215 137 111 (1.3)9. District Hospitals 5 693 894 5 654 230 6 041 896 6 121 592 6 337 719 6 132 000 6 132 202 6 279 149 6 643 371 0.0Total payments and estimates 15 094 877 15 077 221 15 618 193 15 568 004 15 660 045 15 739 260 15 773 326 16 666 348 17 350 499 0.22024/25 Tables 13 above shows the summary of payments and estimates for District Health Services from 2021/22 to 2024/25 per sub-programme and economic classification. The programme%u2019s total expenditure increased from R15.094 billion in 2021/22 to a revised estimate of R15.739 billion in 2024/25. In 2025/26, the budget shows minimal increase of 0.2 per cent from R15.739 billion to R15.773 billion when compared to the 2024/25 revised estimate due to additional funding for wage agreement and funding for the medicines, medical supplies, medical gas, surgical implants, property payments, food for patients and medical and chemical waste. In 2025/26 and 2027/28, the programme allocation amounts to R16.666 billion and R17.350 billion respectively. Table 14: Summary of payments and estimates by economic classification: P2 - District Health Services: Outcome Main appropriationAdjusted appropriation Revised estimate Medium-term estimates % change from 2024/25R thousand 2021/22 2022/23 2023/24 2025/26 2026/27 2027/28Current payments 14 663 863 14 810 440 15 202 615 15 232 678 15 272 766 15 333 669 15 474 498 16 380 701 17 052 000 0.9Compensation of employees 10 117 843 10 137 436 10 770 463 10 824 105 10 816 710 10 796 259 11 134 063 11 512 202 11 774 738 3.1Goods and services 4 691 268 4 504 824 4 424 004 4 408 573 4 456 056 4 537 410 4 340 435 4 868 499 5 277 262 (4.3)Interest and rent on land 1 329 21 603 8 148 %u2013 %u2013 %u2013 %u2013 %u2013 %u2013Transfers and subsidies to: 113 039 296 649 278 389 149 993 206 028 224 340 131 354 151 920 158 756 (41.4)Provinces and municipalities %u2013 %u2013 %u2013 %u2013 %u2013 %u2013 %u2013 %u2013 %u2013Departmental agencies and accounts %u2013 %u2013 %u2013 %u2013 %u2013 %u2013 %u2013 %u2013 %u2013Higher education institutions %u2013 %u2013 %u2013 %u2013 %u2013 %u2013 %u2013 %u2013 %u2013Foreign governments and international organisations %u2013 %u2013 %u2013 %u2013 %u2013 %u2013 %u2013 %u2013 %u2013Public corporations and private enterprises %u2013 %u2013 %u2013 %u2013 %u2013 %u2013 %u2013 %u2013 %u2013Non-profit institutions 26 528 %u2013 35 450 35 942 35 942 35 942 17 892 29 874 31 218 (50.2)Households 113 039 270 121 242 939 114 051 170 086 188 398 113 462 122 046 127 538 (39.8)Payments for capital assets 171 398 116 709 137 189 185 333 181 251 181 251 167 474 133 727 139 743 (7.6)Buildings and other fixed structures %u2013 %u2013 2 257 %u2013 %u2013 %u2013 %u2013 %u2013 %u2013Machinery and equipment 171 398 116 709 134 932 185 333 181 251 181 251 167 474 133 727 139 743 (7.6)Heritage Assets %u2013 %u2013 %u2013 %u2013 %u2013 %u2013 %u2013 %u2013 %u2013Specialised military assets %u2013 %u2013 %u2013 %u2013 %u2013 %u2013 %u2013 %u2013 %u2013Biological assets %u2013 %u2013 %u2013 %u2013 %u2013 %u2013 %u2013 %u2013 %u2013Land and sub-soil assets %u2013 %u2013 %u2013 %u2013 %u2013 %u2013 %u2013 %u2013 %u2013Software and other intangible assets %u2013 %u2013 %u2013 %u2013 %u2013 %u2013 %u2013 %u2013 %u2013Payments for financial assets %u2013 %u2013 %u2013 %u2013 %u2013 %u2013 %u2013 %u2013 %u2013Total economic classification 15 094 877 15 077 221 15 618 193 15 568 004 15 660 045 15 739 260 15 773 326 16 666 348 17 350 499 0.22024/25Table 14 above shows the summary of payments and estimates for District Health Services from 2021/22 to 2024/25 and over the 2025 MTEF per economic classification. Compensation of employees and Goods and services, which make up current payments, are the major cost drivers of the programme. Compensation of employees shows growth of 3.1 per cent from R10.796 billion to R11.134 billion when compared to the 2024/25 revised estimate due to additional allocation for wage agreement. Goods and services show a negative growth of 4.3 per cent from R4.537 billion to R4.340 billion when compared to the 2024/25 revised estimate due to high revised estimate resulting from over expenditure emanating from the payment of accruals and payables. Transfers and subsidies show a negative growth of 41.4 per cent from R224.340 million to R131.354 million when compared to the 2024/25 revised estimate due to high revised estimates resulting from the payment of medico legal claims. 184
