
Page 206 - Demo
P. 206
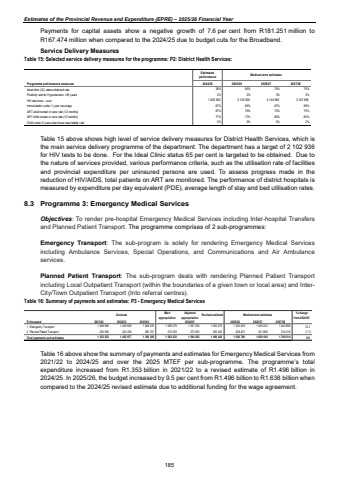
Estimates of the Provincial Revenue and Expenditure (EPRE) %u2013 2025/26 Financial YearPayments for capital assets show a negative growth of 7.6 per cent from R181.251 million to R167.474 million when compared to the 2024/25 due to budget cuts for the Broadband. Service Delivery Measures Table 15: Selected service delivery measures for the programme: P2: District Health Services: Estimatedperformance Medium-term estimatesProgramme performance measures 2024/25 2025/26 2026/27 2027/28Ideal clinic (IC) status obtained rate 38% 65% 70% 75%Positivity rate for Hypertension >45 years 2% 2% 3% 3%HIV test done %u2013 sum 1 625 060 2 102 936 2 144 995 2 187 895Immunisation under 1 year coverage 67% 85% 87% 89%ART adult remain in care rate (12 months) 67% 70% 73% 75%ART child remain in care rate (12 months) 77% 77% 80% 85%Child under 5 years diarrhoea case fatality rate 2% 2% 2% 2% Table 15 above shows high level of service delivery measures for District Health Services, which is the main service delivery programme of the department. The department has a target of 2 102 936 for HIV tests to be done. For the Ideal Clinic status 65 per cent is targeted to be obtained. Due to the nature of services provided, various performance criteria, such as the utilisation rate of facilities and provincial expenditure per uninsured persons are used. To assess progress made in the reduction of HIV/AIDS, total patients on ART are monitored. The performance of district hospitals is measured by expenditure per day equivalent (PDE), average length of stay and bed utilisation rates. 8.3 Programme 3: Emergency Medical Services Objectives: To render pre-hospital Emergency Medical Services including Inter-hospital Transfers and Planned Patient Transport. The programme comprises of 2 sub-programmes: Emergency Transport: The sub-program is solely for rendering Emergency Medical Services including Ambulance Services, Special Operations, and Communications and Air Ambulance services. Planned Patient Transport: The sub-program deals with rendering Planned Patient Transport including Local Outpatient Transport (within the boundaries of a given town or local area) and InterCity/Town Outpatient Transport (Into referral centres).Table 16: Summary of payments and estimates: P3 - Emergency Medical Services Outcome Main appropriationAdjusted appropriation Revised estimate Medium-term estimates % change from 2024/25R thousand 2021/22 2022/23 2023/24 2025/26 2026/27 2027/281. Emergency Transport 1 089 966 1 209 639 1 069 678 1 289 079 1 291 030 1 203 015 1 350 299 1 348 232 1 432 896 12.22. Planned Patient Transport 263 556 243 238 290 707 273 553 273 553 293 405 288 407 301 868 316 318 (1.7)Total payments and estimates 1 353 522 1 452 877 1 360 385 1 562 632 1 564 583 1 496 420 1 638 706 1 650 100 1 749 214 9.52024/25 Table 16 above show the summary of payments and estimates for Emergency Medical Services from 2021/22 to 2024/25 and over the 2025 MTEF per sub-programme. The programme%u2019s total expenditure increased from R1.353 billion in 2021/22 to a revised estimate of R1.496 billion in 2024/25. In 2025/26, the budget increased by 9.5 per cent from R1.496 billion to R1.638 billion when compared to the 2024/25 revised estimate due to additional funding for the wage agreement. 185
