
Page 24 - Demo
P. 24
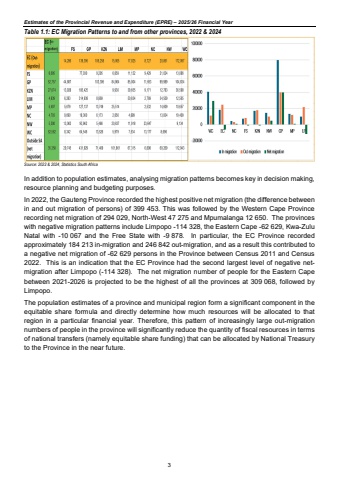
Estimates of the Provincial Revenue and Expenditure (EPRE) %u2013 2025/26 Financial YearTable 1.1: EC Migration Patterns to and from other provinces, 2022 & 2024 Source: 2022 & 2024, Statistics South Africa In addition to population estimates, analysing migration patterns becomes key in decision making, resource planning and budgeting purposes. In 2022, the Gauteng Province recorded the highest positive net migration (the difference between in and out migration of persons) of 399 453. This was followed by the Western Cape Province recording net migration of 294 029, North-West 47 275 and Mpumalanga 12 650. The provinces with negative migration patterns include Limpopo -114 328, the Eastern Cape -62 629, Kwa-Zulu Natal with -10 067 and the Free State with -9 878. In particular, the EC Province recorded approximately 184 213 in-migration and 246 842 out-migration, and as a result this contributed to a negative net migration of -62 629 persons in the Province between Census 2011 and Census 2022. This is an indication that the EC Province had the second largest level of negative netmigration after Limpopo (-114 328). The net migration number of people for the Eastern Cape between 2021-2026 is projected to be the highest of all the provinces at 309 068, followed by Limpopo. The population estimates of a province and municipal region form a significant component in the equitable share formula and directly determine how much resources will be allocated to that region in a particular financial year. Therefore, this pattern of increasingly large out-migration numbers of people in the province will significantly reduce the quantity of fiscal resources in terms of national transfers (namely equitable share funding) that can be allocated by National Treasury to the Province in the near future. 3
