
Page 25 - Demo
P. 25
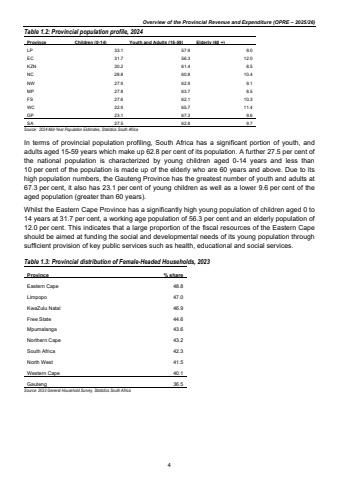
Overview of the Provincial Revenue and Expenditure (OPRE %u2013 2025/26)Table 1.2: Provincial population profile, 2024 Province Children (0-14) Youth and Adults (15-59) Elderly (60 +) LP 33.1 57.9 9.0EC 31.7 56.3 12.0KZN 30.2 61.4 8.5NC 28.8 60.8 10.4NW 27.9 62.9 9.1MP 27.8 63.7 8.5FS 27.6 62.1 10.3WC 22.9 65.7 11.4GP 23.1 67.3 9.6SA 27.5 62.8 9.7Source: 2024 Mid-Year Population Estimates, Statistics South AfricaIn terms of provincial population profiling, South Africa has a significant portion of youth, and adults aged 15-59 years which make up 62.8 per cent of its population. A further 27.5 per cent of the national population is characterized by young children aged 0-14 years and less than 10 per cent of the population is made up of the elderly who are 60 years and above. Due to its high population numbers, the Gauteng Province has the greatest number of youth and adults at 67.3 per cent, it also has 23.1 per cent of young children as well as a lower 9.6 per cent of the aged population (greater than 60 years). Whilst the Eastern Cape Province has a significantly high young population of children aged 0 to 14 years at 31.7 per cent, a working age population of 56.3 per cent and an elderly population of 12.0 per cent. This indicates that a large proportion of the fiscal resources of the Eastern Cape should be aimed at funding the social and developmental needs of its young population through sufficient provision of key public services such as health, educational and social services. Table 1.3: Provincial distribution of Female-Headed Households, 2023 Province % share Eastern Cape 48.8 Limpopo 47.0KwaZulu Natal 46.9 Free State 44.6 Mpumalanga 43.6Northern Cape 43.2 South Africa 42.3 North West 41.5 Western Cape 40.1 Gauteng 36.5Source: 2033 General Household Survey, Statistics South Africa 4
