
Page 28 - Demo
P. 28
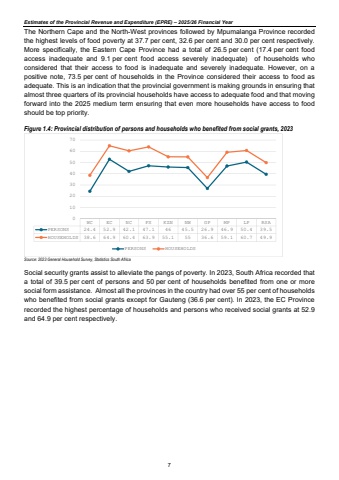
Estimates of the Provincial Revenue and Expenditure (EPRE) %u2013 2025/26 Financial YearThe Northern Cape and the North-West provinces followed by Mpumalanga Province recorded the highest levels of food poverty at 37.7 per cent, 32.6 per cent and 30.0 per cent respectively. More specifically, the Eastern Cape Province had a total of 26.5 per cent (17.4 per cent food access inadequate and 9.1 per cent food access severely inadequate) of households who considered that their access to food is inadequate and severely inadequate. However, on a positive note, 73.5 per cent of households in the Province considered their access to food as adequate. This is an indication that the provincial government is making grounds in ensuring that almost three quarters of its provincial households have access to adequate food and that moving forward into the 2025 medium term ensuring that even more households have access to food should be top priority. Figure 1.4: Provincial distribution of persons and households who benefited from social grants, 2023 Source: 2023 General Household Survey, Statistics South Africa Social security grants assist to alleviate the pangs of poverty. In 2023, South Africa recorded that a total of 39.5 per cent of persons and 50 per cent of households benefited from one or more social form assistance. Almost all the provinces in the country had over 55 per cent of households who benefited from social grants except for Gauteng (36.6 per cent). In 2023, the EC Province recorded the highest percentage of households and persons who received social grants at 52.9 and 64.9 per cent respectively. WC EC NC FS KZN NW GP MP LP RSAPERSONS 24.4 52.9 42.1 47.1 46 45.5 26.9 46.9 50.4 39.5HOUSEHOLDS 38.6 64.9 60.4 63.9 55.1 55 36.6 59.1 60.7 49.9010203040506070PERSONS HOUSEHOLDS7
