
Page 27 - Demo
P. 27
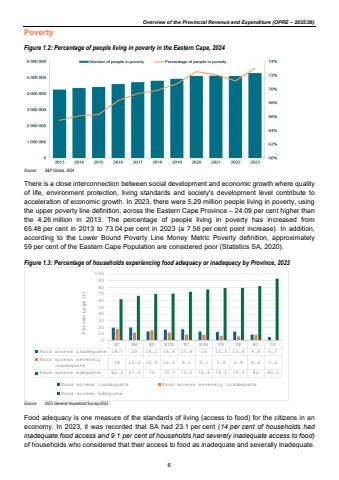
Overview of the Provincial Revenue and Expenditure (OPRE %u2013 2025/26)Poverty Figure 1.2: Percentage of people living in poverty in the Eastern Cape, 2024 Source: S&P Global, 2024 There is a close interconnection between social development and economic growth where quality of life, environment protection, living standards and society's development level contribute to acceleration of economic growth. In 2023, there were 5.29 million people living in poverty, using the upper poverty line definition, across the Eastern Cape Province %u2013 24.09 per cent higher than the 4.26 million in 2013. The percentage of people living in poverty has increased from 65.48 per cent in 2013 to 73.04 per cent in 2023 (a 7.56 per cent point increase). In addition, according to the Lower Bound Poverty Line Money Metric Poverty definition, approximately 59 per cent of the Eastern Cape Population are considered poor (Statistics SA, 2020). Figure 1.3: Percentage of households experiencing food adequacy or inadequacy by Province, 2023 Source: 2023 General Household Survey,2023 Food adequacy is one measure of the standards of living (access to food) for the citizens in an economy. In 2023, it was recorded that SA had 23.1 per cent (14 per cent of households had inadequate food access and 9.1 per cent of households had severely inadequate access to food)of households who considered that their access to food as inadequate and severally inadequate. NC NW MP KZN EC RSA FS GP WC LPFood access inadequate 19.7 20 14.1 16.8 17.4 14 13.3 13.9 9.4 5.7Food access severelyinadequate 18 12.6 15.9 12.5 9.1 9.1 7.6 6.8 8.6 1.2Food access adequate 62.3 67.4 70 70.7 73.5 76.9 79.1 79.3 82 93.10102030405060708090100Percentage(%)Food access inadequate Food access severely inadequateFood access adequate6
