
Page 29 - Demo
P. 29
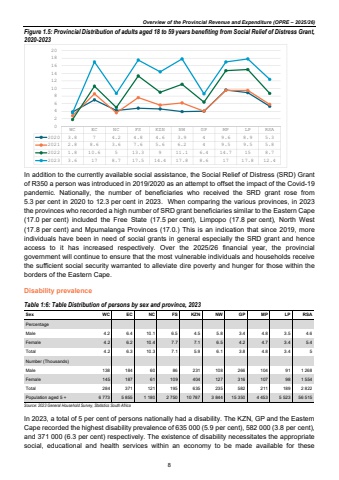
Overview of the Provincial Revenue and Expenditure (OPRE %u2013 2025/26)Figure 1.5: Provincial Distribution of adults aged 18 to 59 years benefiting from Social Relief of Distress Grant, 2020-2023 In addition to the currently available social assistance, the Social Relief of Distress (SRD) Grant of R350 a person was introduced in 2019/2020 as an attempt to offset the impact of the Covid-19 pandemic. Nationally, the number of beneficiaries who received the SRD grant rose from 5.3 per cent in 2020 to 12.3 per cent in 2023. When comparing the various provinces, in 2023 the provinces who recorded a high number of SRD grant beneficiaries similar to the Eastern Cape (17.0 per cent) included the Free State (17.5 per cent), Limpopo (17.8 per cent), North West (17.8 per cent) and Mpumalanga Provinces (17.0.) This is an indication that since 2019, more individuals have been in need of social grants in general especially the SRD grant and hence access to it has increased respectively. Over the 2025/26 financial year, the provincial government will continue to ensure that the most vulnerable individuals and households receive the sufficient social security warranted to alleviate dire poverty and hunger for those within the borders of the Eastern Cape. Disability prevalence Table 1:6: Table Distribution of persons by sex and province, 2023 Sex WC EC NC FS KZN NW GP MP LP RSA Percentage Male 4.2 6.4 10.1 6.5 4.5 5.8 3.4 4.8 3.5 4.6 Female 4.2 6.2 10.4 7.7 7.1 6.5 4.2 4.7 3.4 5.4 Total 4.2 6.3 10.3 7.1 5.9 6.1 3.8 4.8 3.4 5 Number (Thousands) Male 138 184 60 86 231 108 266 104 91 1 268 Female 145 187 61 109 404 127 316 107 98 1 554 Total 284 371 121 195 635 235 582 211 189 2 822 Population aged 5 + 6 773 5 855 1 180 2 750 10 787 3 844 15 350 4 453 5 523 56 515 Source: 2023 General Household Survey, Statistics South Africa In 2023, a total of 5 per cent of persons nationally had a disability. The KZN, GP and the Eastern Cape recorded the highest disability prevalence of 635 000 (5.9 per cent), 582 000 (3.8 per cent), and 371 000 (6.3 per cent) respectively. The existence of disability necessitates the appropriate social, educational and health services within an economy to be made available for these WC EC NC FS KZN NW GP MP LP RSA2020 3.8 7 4.2 4.8 4.6 3.9 4 9.6 8.9 5.32021 2.8 8.6 3.6 7.6 5.6 6.2 4 9.5 9.5 5.82022 1.8 10.6 5 13.3 9 11.1 6.4 14.7 15 8.72023 3.6 17 8.7 17.5 14.4 17.8 8.6 17 17.8 12.4024681012141618208
