
Page 283 - Demo
P. 283
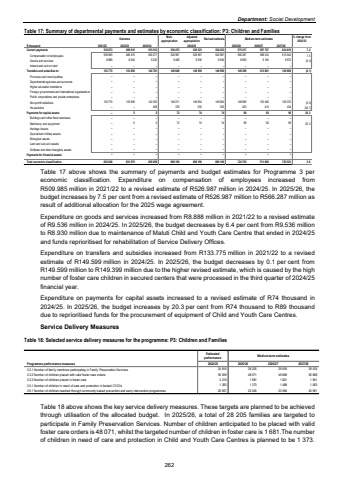
Department: Social DevelopmentTable 17: Summary of departmental payments and estimates by economic classification: P3: Children and Families Outcome Main appropriationAdjusted appropriation Revised estimate Medium-term estimates % change from 2024/25R thousand 2021/22 2022/23 2023/24 2025/26 2026/27 2027/28Current payments 498 016 518 873 515 512 536 475 536 523 536 523 575 217 597 707 624 619 7.2Compensation of employees 489 476 509 985 506 277 526 987 526 987 526 987 566 287 588 543 615 044 7.5Goods and services 8 540 8 888 9 235 9 488 9 536 9 536 8 930 9 164 9 575 (6.4)Interest and rent on land %u2013 %u2013 %u2013 %u2013 %u2013 %u2013 %u2013 %u2013 %u2013 Transfers and subsidies to: 133 858 133 775 142 781 149 649 149 599 149 599 149 399 153 881 160 806 (0.1)Provinces and municipalities %u2013 %u2013 %u2013 %u2013 %u2013 %u2013 %u2013 %u2013 %u2013 Departmental agencies and accounts %u2013 %u2013 %u2013 %u2013 %u2013 %u2013 %u2013 %u2013 %u2013 Higher education institutions %u2013 %u2013 %u2013 %u2013 %u2013 %u2013 %u2013 %u2013 %u2013Foreign governments and international organisations %u2013 %u2013 %u2013 %u2013 %u2013 %u2013 %u2013 %u2013 %u2013Public corporations and private enterprises %u2013 %u2013 %u2013 %u2013 %u2013 %u2013 %u2013 %u2013 %u2013Non-profit institutions 133 775 133 858 142 323 149 271 149 064 149 064 148 996 153 466 160 372 (0.0)Households %u2013 %u2013 458 378 535 535 403 415 434 (24.7)Payments for capital assets %u2013 5 5 72 74 74 89 92 96 20.3Buildings and other fixed structures %u2013 %u2013 %u2013 %u2013 %u2013 %u2013 %u2013 %u2013 %u2013Machinery and equipment %u2013 5 5 72 74 74 89 92 96 20.3Heritage Assets %u2013 %u2013 %u2013 %u2013 %u2013 %u2013 %u2013 %u2013 %u2013Specialised military assets %u2013 %u2013 %u2013 %u2013 %u2013 %u2013 %u2013 %u2013 %u2013Biological assets %u2013 %u2013 %u2013 %u2013 %u2013 %u2013 %u2013 %u2013 %u2013Land and sub-soil assets %u2013 %u2013 %u2013 %u2013 %u2013 %u2013 %u2013 %u2013 %u2013Software and other intangible assets %u2013 %u2013 %u2013 %u2013 %u2013 %u2013 %u2013 %u2013 %u2013Payments for financial assets %u2013 %u2013 %u2013 %u2013 %u2013 %u2013 %u2013 %u2013 %u2013Total economic classification 652 648 631 879 658 298 686 196 686 196 686 196 724 705 751 680 785 521 5.62024/25Table 17 above shows the summary of payments and budget estimates for Programme 3 per economic classification. Expenditure on compensation of employees increased from R509.985 million in 2021/22 to a revised estimate of R526.987 million in 2024/25. In 2025/26, the budget increases by 7.5 per cent from a revised estimate of R526.987 million to R566.287 million as result of additional allocation for the 2025 wage agreement. Expenditure on goods and services increased from R8.888 million in 2021/22 to a revised estimate of R9.536 million in 2024/25. In 2025/26, the budget decreases by 6.4 per cent from R9.536 million to R8.930 million due to maintenance of Maluti Child and Youth Care Centre that ended in 2024/25 and funds reprioritised for rehabilitation of Service Delivery Offices. Expenditure on transfers and subsidies increased from R133.775 million in 2021/22 to a revised estimate of R149.599 million in 2024/25. In 2025/26, the budget decreases by 0.1 per cent from R149.599 million to R149.399 million due to the higher revised estimate, which is caused by the high number of foster care children in secured centers that were processed in the third quarter of 2024/25 financial year. Expenditure on payments for capital assets increased to a revised estimate of R74 thousand in 2024/25. In 2025/26, the budget increases by 20.3 per cent from R74 thousand to R89 thousand due to reprioritised funds for the procurement of equipment of Child and Youth Care Centres. Service Delivery Measures Table 18: Selected service delivery measures for the programme: P3: Children and Families Estimatedperformance Medium-term estimatesProgramme performance measures 2024/25 2025/26 2026/27 2027/283.2.1 Number of family members participating in Family Preservation Services. 24 816 28 205 29 093 29 5353.3.2 Number of children placed with valid foster care orders 50 559 48 071 49 808 50 6683.3.3 Number of children placed in foster care 3 216 1 681 1 821 1 9413.5.1 Number of children in need of care and protection in funded CYCCs 1 383 1 373 1 488 1 5833.6.1 Number of children reached through community based prevention and early intervention programmes 20 837 22 545 23 584 24 961Table 18 above shows the key service delivery measures. These targets are planned to be achieved through utilisation of the allocated budget. In 2025/26, a total of 28 205 families are targeted to participate in Family Preservation Services. Number of children anticipated to be placed with valid foster care orders is 48 071, whilst the targeted number of children in foster care is 1 681.The number of children in need of care and protection in Child and Youth Care Centres is planned to be 1 373. 262
