
Page 284 - Demo
P. 284
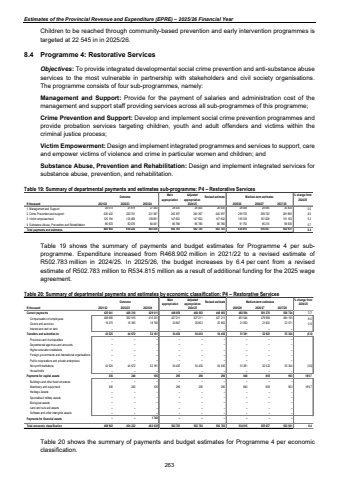
Estimates of the Provincial Revenue and Expenditure (EPRE) %u2013 2025/26 Financial YearChildren to be reached through community-based prevention and early intervention programmes is targeted at 22 545 in in 2025/26. 8.4 Programme 4: Restorative Services Objectives: To provide integrated developmental social crime prevention and anti-substance abuse services to the most vulnerable in partnership with stakeholders and civil society organisations. The programme consists of four sub-programmes, namely: Management and Support: Provide for the payment of salaries and administration cost of the management and support staff providing services across all sub-programmes of this programme;Crime Prevention and Support: Develop and implement social crime prevention programmes and provide probation services targeting children, youth and adult offenders and victims within the criminal justice process;Victim Empowerment: Design and implement integrated programmes and services to support, care and empower victims of violence and crime in particular women and children; and Substance Abuse, Prevention and Rehabilitation: Design and implement integrated services for substance abuse, prevention, and rehabilitation. Table 19: Summary of departmental payments and estimates sub-programme: P4 %u2013 Restorative Services Outcome Main appropriationAdjusted appropriation Revised estimate Medium-term estimates % change from 2024/25R thousand 2021/22 2022/23 2023/24 2025/26 2026/27 2027/281. Management and Support 30 673 25 979 27 340 28 004 28 004 28 004 28 006 29 094 30 403 0.02. Crime Prevention and support 226 432 220 701 231 387 240 397 240 397 240 397 259 723 269 720 281 865 8.03. Victim empowerment 125 194 125 466 139 851 147 602 147 602 147 602 155 333 161 028 151 163 5.24. Substance Abuse, Prevention and Rehabilitation 86 603 82 076 84 461 86 780 86 780 86 780 91 753 95 215 99 500 5.7Total payments and estimates 468 902 454 222 483 039 502 783 502 783 502 783 534 815 555 057 562 931 6.42024/25Table 19 shows the summary of payments and budget estimates for Programme 4 per subprogramme. Expenditure increased from R468.902 million in 2021/22 to a revised estimate of R502.783 million in 2024/25. In 2025/26, the budget increases by 6.4 per cent from a revised estimate of R502.783 million to R534.815 million as a result of additional funding for the 2025 wage agreement. Table 20: Summary of departmental payments and estimates by economic classification: P4 %u2013 Restorative Services Outcome Main appropriationAdjusted appropriation Revised estimate Medium-term estimates % change from 2024/25R thousand 2021/22 2022/23 2023/24 2025/26 2026/27 2027/28Current payments 409 310 425 041 429 011 448 058 448 063 448 063 482 594 501 270 506 724 7.7Compensation of employees 408 666 392 915 410 251 427 211 427 211 427 211 461 544 479 668 484 153 8.0Goods and services 16 375 16 395 18 760 20 847 20 852 20 852 21 050 21 602 22 571 0.9Interest and rent on land %u2013 %u2013 %u2013 %u2013 %u2013 %u2013 %u2013 %u2013 %u2013Transfers and subsidies to: 43 525 44 672 52 181 54 430 54 430 54 430 51 381 52 922 55 304 (5.6)Provinces and municipalities %u2013 %u2013 %u2013 %u2013 %u2013 %u2013 %u2013 %u2013 %u2013Departmental agencies and accounts %u2013 %u2013 %u2013 %u2013 %u2013 %u2013 %u2013 %u2013 %u2013Higher education institutions %u2013 %u2013 %u2013 %u2013 %u2013 %u2013 %u2013 %u2013 %u2013Foreign governments and international organisations %u2013 %u2013 %u2013 %u2013 %u2013 %u2013 %u2013 %u2013 %u2013Public corporations and private enterprises %u2013 %u2013 %u2013 %u2013 %u2013 %u2013 %u2013 %u2013 %u2013Non-profit institutions 43 525 44 672 52 181 54 430 54 430 54 430 51 381 52 922 55 304 (5.6)Households %u2013 %u2013 %u2013 %u2013 %u2013 %u2013 %u2013 %u2013 %u2013Payments for capital assets 336 240 105 295 290 290 840 865 903 189.7Buildings and other fixed structures %u2013 %u2013 %u2013 %u2013 %u2013 %u2013 %u2013 %u2013 %u2013Machinery and equipment 336 240 105 295 290 290 840 865 903 189.7Heritage Assets %u2013 %u2013 %u2013 %u2013 %u2013 %u2013 %u2013 %u2013 %u2013Specialised military assets %u2013 %u2013 %u2013 %u2013 %u2013 %u2013 %u2013 %u2013 %u2013Biological assets %u2013 %u2013 %u2013 %u2013 %u2013 %u2013 %u2013 %u2013 %u2013Land and sub-soil assets %u2013 %u2013 %u2013 %u2013 %u2013 %u2013 %u2013 %u2013 %u2013Software and other intangible assets %u2013 %u2013 %u2013 %u2013 %u2013 %u2013 %u2013 %u2013 %u2013Payments for financial assets %u2013 %u2013 1 742 %u2013 %u2013 %u2013 %u2013 %u2013 %u2013Total economic classification 468 902 454 222 483 039 502 783 502 783 502 783 534 815 555 057 562 931 6.42024/25Table 20 shows the summary of payments and budget estimates for Programme 4 per economic classification. 263
