
Page 368 - Demo
P. 368
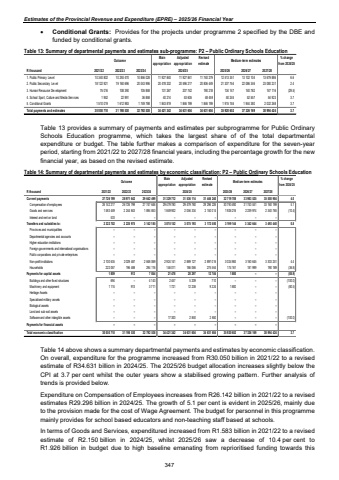
Estimates of the Provincial Revenue and Expenditure (EPRE) %u2013 2025/26 Financial Year%uf0b7 Conditional Grants: Provides for the projects under programme 2 specified by the DBE and funded by conditional grants. Table 13: Summary of departmental payments and estimates sub-programme: P2 %u2013 Public Ordinary Schools Education OutcomeMain appropriationAdjusted appropriationRevised estimate Medium-term estimates % change from 2024/25R thousand 2021/22 2022/23 2023/24 2025/26 2026/27 2027/281. Public Primary Lev el 10 340 802 10 293 470 10 856 028 11 927 840 11 927 841 11 740 279 12 513 351 13 102 104 13 679 886 6.62. Public Secondary Lev el 18 122 921 19 160 696 20 043 996 20 478 202 20 596 217 20 806 449 21 307 754 22 086 346 23 080 231 2.43. Human Resource Dev elopment 75 016 108 390 105 858 131 267 207 742 190 218 134 147 140 782 147 116 (29.5)4. School Sport, Culture and Media Serv ices 1 952 22 991 36 858 40 214 53 605 48 459 50 245 52 557 54 923 3.75. Conditional Grants 1 510 019 1 612 983 1 749 798 1 843 819 1 846 199 1 846 199 1 915 155 1 944 380 2 032 268 3.7Total payments and estimates 30 050 710 31 198 530 32 792 538 34 421 342 34 631 604 34 631 604 35 920 652 37 326 169 38 994 424 3.72024/25 Table 13 provides a summary of payments and estimates per subprogramme for Public Ordinary Schools Education programme, which takes the largest share of of the total departmental expenditure or budget. The table further makes a comparison of expenditure for the seven-year period, starting from 2021/22 to 2027/28 financial years, including the percentage growth for the new financial year, as based on the revised estimate. Table 14: Summary of departmental payments and estimates by economic classification: P2 %u2013 Public Ordinary Schools Education Outcome Main appropriationAdjusted appropriationRevised estimateMedium-term estimates % change from 2024/25R thousand 2021/22 2022/23 2023/24 2025/26 2026/27 2027/28Current payments 27 726 199 28 971 642 29 642 499 31 329 712 31 536 114 31 446 240 32 719 708 33 983 525 35 500 984 4.0Compensation of employ ees 26 142 217 26 726 799 27 747 646 29 479 780 29 479 780 29 296 226 30 793 492 31 743 551 33 160 199 5.1Goods and serv ices 1 583 449 2 244 843 1 894 853 1 849 932 2 056 334 2 150 014 1 926 216 2 239 974 2 340 785 (10.4)Interest and rent on land 533 %u2013 %u2013 %u2013 %u2013 %u2013 %u2013 %u2013 %u2013 Transfers and subsidies to: 2 322 702 2 225 975 3 142 185 3 070 152 3 075 193 3 172 580 3 199 144 3 342 644 3 493 440 0.8Prov inces and municipalities %u2013 %u2013 %u2013 %u2013 %u2013 %u2013 %u2013 %u2013 %u2013 Departmental agencies and accounts %u2013 %u2013 %u2013 %u2013 %u2013 %u2013 %u2013 %u2013 %u2013 Higher education institutions %u2013 %u2013 %u2013 %u2013 %u2013 %u2013 %u2013 %u2013 %u2013 Foreign gov ernments and international organisations %u2013 %u2013 %u2013 %u2013 %u2013 %u2013 %u2013 %u2013 %u2013 Public corporations and priv ate enterprises %u2013 %u2013 %u2013 %u2013 %u2013 %u2013 %u2013 %u2013 %u2013Non-profit institutions 2 100 635 2 029 487 2 848 069 2 924 141 2 889 127 2 897 016 3 024 983 3 160 645 3 303 251 4.4Households 222 067 196 488 294 116 146 011 186 066 275 564 174 161 181 999 190 189 (36.8)Payments for capital assets 1 809 913 7 854 21 478 20 297 12 784 1 800 %u2013 (85.9) %u2013Buildings and other fix ed structures 694 4 143 %u2013 2 457 5 209 710 %u2013 %u2013 (100.0) %u2013Machinery and equipment 1 115 913 3 711 1 721 12 238 9 224 1 800 %u2013 (80.5) %u2013Heritage Assets %u2013 %u2013 %u2013 %u2013 %u2013 %u2013 %u2013 %u2013 %u2013Specialised military assets %u2013 %u2013 %u2013 %u2013 %u2013 %u2013 %u2013 %u2013 %u2013Biological assets %u2013 %u2013 %u2013 %u2013 %u2013 %u2013 %u2013 %u2013 %u2013Land and sub-soil assets %u2013 %u2013 %u2013 %u2013 %u2013 %u2013 %u2013 %u2013 %u2013Softw are and other intangible assets %u2013 %u2013 17 300 %u2013 2 850 2 850 %u2013 %u2013 (100.0) %u2013Payments for financial assets %u2013 %u2013 %u2013 %u2013 %u2013 %u2013 %u2013 %u2013 %u2013Total economic classification 30 050 710 31 198 530 32 792 538 34 421 342 34 631 604 34 631 604 35 920 652 37 326 169 38 994 424 3.72024/25 Table 14 above shows a summary departmental payments and estimates by economic classification. On overall, expenditure for the programme increased from R30.050 billion in 2021/22 to a revised estimate of R34.631 billion in 2024/25. The 2025/26 budget allocation increases slightly below the CPI at 3.7 per cent whilst the outer years show a stabilised growing pattern. Further analysis of trends is provided below. Expenditure on Compensation of Employees increases from R26.142 billion in 2021/22 to a revised estimates R29.296 billion in 2024/25. The growth of 5.1 per cent is evident in 2025/26, mainly due to the provision made for the cost of Wage Agreement. The budget for personnel in this programme mainly provides for school based educators and non-teaching staff based at schools. In terms of Goods and Services, expenditured increased from R1.583 billion in 2021/22 to a revised estimate of R2.150 billion in 2024/25, whilst 2025/26 saw a decrease of 10.4 per cent to R1.926 billion in budget due to high baseline emanating from reprioritised funding towards this 347
