
Page 370 - Demo
P. 370
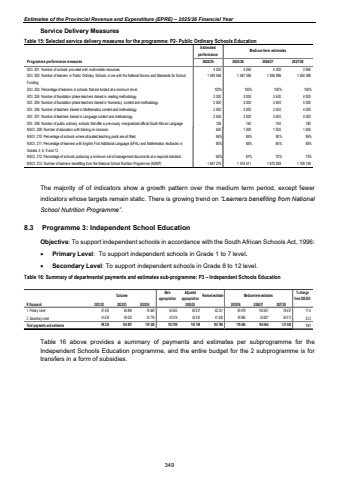
Estimates of the Provincial Revenue and Expenditure (EPRE) %u2013 2025/26 Financial YearService Delivery Measures Table 15: Selected service delivery measures for the programme: P2- Public Ordinary Schools EducationEstimatedperformanceMedium-term estimatesProgramme performance measures 2024/25 2025/26 2026/27 2027/28SOI. 201: Number of schools prov ided w ith multi-media resources. 4 200 4 050 4 000 3 950 SOI. 202: Number of learners in Public Ordinary Schools in ine w ith the National Norms and Standards for School Funding 1 467 396 1 494 556 1 458 896 1 450 396 SOI. 203: Percentage of learners in schools that are funded at a minimum lev el. 100% 100% 100% 100%SOI. 204: Number of foundation phase teachers trained in reading methodology 2 000 3 000 3 500 4 000SOI. 205: Number of foundation phase teachers trained in Numeracy content and methodology 2 500 3 000 3 500 4 000SOI. 206: Number of teachers trained in Mathematics content and methodology 2 500 3 000 3 500 4 000SOI. 207: Number of teachers trained in Language content and methodology 2 500 3 000 3 500 4 000SOI. 208: Number of public ordinary schools that offer a prev iously marginalized official South African Language 126 140 160 180NSOI. 209: Number of educators w ith training on inclusion 500 1 000 1 000 1 500NSOI. 210: Percentage of schools w here allocated teaching posts are all filled. 85% 85% 90% 95%NSOI. 211: Percentage of learners w ith English First Additional Language (EFAL) and Mathematics tex tbooks in Grades 3, 6, 9 and 12.80% 85% 85% 85%NSOI. 212: Percentage of schools producing a minimum set of management documents at a required standard. 65% 67% 70% 73%NSOI. 213: Number of learners benefitting from the National School Nutrition Programme (NSNP) 1 657 275 1 574 511 1 670 288 1 708 159 The majority of of indicators show a growth pattern over the medium term period, except fewer indicators whose targets remain static. There is growing trend on %u201cLearners benefiting from National School Nutrition Programme%u201d. 8.3 Programme 3: Independent School Education Objective: To support independent schools in accordance with the South African Schools Act, 1996: %uf0b7 Primary Level: To support independent schools in Grade 1 to 7 level. %uf0b7 Secondary Level: To support independent schools in Grade 8 to 12 level. Table 16: Summary of departmental payments and estimates sub-programme: P3 %u2013 Independent Schools Education Outcome Main appropriationAdjusted appropriation Revised estimate Medium-term estimates % change from 2024/25R thousand 2021/22 2022/23 2023/24 2025/26 2026/27 2027/281. Primary Level 95 894 57 592 76 569 60 453 60 837 62 231 69 479 100 637 76 637 11.62. Secondary Level 41 634 59 003 33 776 43 316 42 932 41 538 49 985 63 827 54 913 20.3Total payments and estimates 99 226 154 897 110 345 103 769 103 769 103 769 119 464 164 464 131 550 15.12024/25 Table 16 above provides a summary of payments and estimates per subprogramme for the Independent Schools Education programme, and the entire budget for the 2 subprogramme is for transfers in a form of subsidies. 349
