
Page 380 - Demo
P. 380
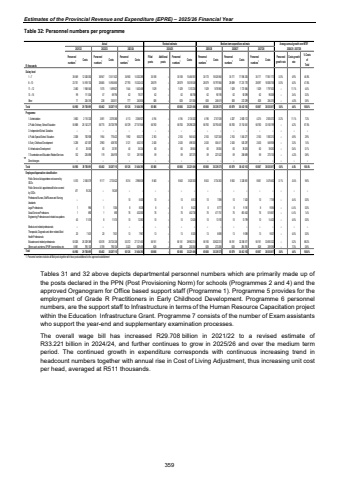
Estimates of the Provincial Revenue and Expenditure (EPRE) %u2013 2025/26 Financial YearTable 32: Personnel numbers per programme Actual Revised estimate Medium-term expenditure estimateR thousandsPersonnel numbers1 Costs Personnel numbers1 Costs Personnel numbers1 Costs Filled postsAdditional postsPersonnel numbers1 Costs Personnel numbers1 Costs Personnel numbers1 Costs Personnel numbers1 Costs Personnel growth rate Costs growth rate % Costs of Total Salary level1 %u2013 7 38 549 12 526 053 36 947 13 511 623 34 950 14 302 269 35 168 %u2013 35 168 15 484 931 35 170 16 525 946 35 171 17 094 305 35 171 17 851 173 0.0% 4.9% 46.8%8 %u2013 10 23 751 14 918 743 26 665 14 955 855 27 793 15 332 433 28 079 %u2013 28 079 16 018 536 28 079 16 797 856 28 089 17 231 776 28 097 18 006 758 0.0% 4.0% 47.6%11 %u2013 12 2 480 1 948 545 1 575 1 499 827 1 544 1 450 488 1 529 %u2013 1 529 1 310 235 1 529 1 676 965 1 529 1 721 684 1 529 1 797 503 %u2013 11.1% 4.5%13 %u2013 16 99 111 034 57 69 794 62 78 371 62 %u2013 62 86 788 62 90 190 62 92 099 62 96 008 %u2013 3.4% 0.3%Other 71 204 316 238 250 011 777 240 835 828 %u2013 828 321 004 828 248 419 828 272 299 828 284 375 %u2013 -4.0% 0.8%Total 64 950 29 708 691 65 482 30 287 110 65 126 31 404 395 65 666 %u2013 65 666 33 221 494 65 668 35 339 375 65 679 36 412 163 65 687 38 035 817 0.0% 4.6% 100.0%Programme1. Administration 3 663 2 116 333 3 591 2 076 368 4 113 2 056 927 4 194 %u2013 4 194 2 135 302 4 196 2 747 538 4 207 2 800 112 4 215 2 925 072 0.2% 11.1% 7.3%2. Public Ordinary School Education 55 868 26 142 217 56 775 26 726 799 55 729 27 747 646 56 760 %u2013 56 760 29 296 226 56 760 30 793 492 56 760 31 743 551 56 760 33 160 199 %u2013 4.2% 87.5%3. Independent School Subsidies %u2013 %u2013 %u2013 %u2013 %u2013 %u2013 %u2013 %u2013 %u2013 %u2013 %u2013 %u2013 %u2013 %u2013 %u2013 %u2013 %u2013 %u2013 %u20134. Public Special School Education 2 008 762 938 1 954 776 423 1 992 830 273 2 163 %u2013 2 163 945 543 2 163 1 027 248 2 163 1 045 271 2 163 1 092 210 %u2013 4.9% 2.9%5. Early Childhood Development 3 238 421 007 2 983 408 783 3 121 452 310 2 430 %u2013 2 430 498 303 2 430 504 411 2 430 525 297 2 430 548 938 %u2013 3.3% 1.5%6. Infrastructure Development 41 30 500 60 33 761 40 35 334 60 %u2013 60 38 845 60 39 264 60 39 263 60 39 263 %u2013 0.4% 0.1%7. Examination and Education Related Services 132 235 696 119 264 976 131 281 905 59 %u2013 59 307 275 59 227 422 59 258 669 59 270 135 %u2013 -4.2% 0.8%Direct charges %u2013 %u2013 %u2013 %u2013 %u2013 %u2013 %u2013 %u2013 %u2013 %u2013 %u2013 %u2013 %u2013 %u2013 %u2013 %u2013 %u2013 %u2013 %u2013Total 64 950 29 708 691 65 482 30 287 110 65 126 31 404 395 65 666 %u2013 65 666 33 221 494 65 668 35 339 375 65 679 36 412 163 65 687 38 035 817 0.0% 4.6% 100.0%Employee dispensation classificationPublic Service Act appointees not covered by OSDs 5 510 2 550 078 9 117 2 733 522 8 314 2 986 836 8 540 %u2013 8 540 3 520 303 8 543 3 734 363 8 553 3 326 851 8 561 3 476 462 0.1% -0.4% 9.6%Public Service Act appointees still to be covered by OSDs 471 18 252 %u201318 249 %u2013 %u2013 %u2013 %u2013 %u2013 %u2013 %u2013 %u2013 %u2013 %u2013 %u2013 %u2013 %u2013 %u2013 %u2013Professional Nurses, Staff Nurses and Nursing Assistants %u2013 - %u2013 - 10 6 500 10 %u2013 10 6 812 10 7 098 10 7 425 10 7 759 %u2013 4.4% 0.0%Legal Professionals 1 994 1 1 004 8 8 038 8 %u2013 8 8 423 8 8 777 8 9 181 8 9 594 %u2013 4.4% 0.0%Social Services Professions 1 690 1 690 76 432 000 76 %u2013 76 452 736 76 471 751 76 493 452 76 515 657 %u2013 4.4% 1.4%Engineering Professions and related occupations 40 11 574 8 11 574 10 12 083 10 %u2013 10 12 626 10 13 192 10 13 799 10 14 420 %u2013 4.5% 0.0%Medical and related professionals %u2013 - %u2013 - %u2013 %u2013 %u2013 %u2013 %u2013 %u2013 %u2013 %u2013 %u2013 %u2013 %u2013 %u2013 %u2013 %u2013 %u2013Therapeutic, Diagnostic and other related Allied Health Professionals 20 7 631 20 7 631 13 7 967 13 %u2013 13 8 325 13 8 698 13 9 098 13 9 507 %u2013 4.5% 0.0%Educators and related professionals 50 026 26 329 369 50 576 26 724 336 53 372 27 121 483 56 181 %u2013 56 181 28 962 214 56 180 30 822 210 56 181 32 256 571 56 181 33 693 322 %u2013 5.2% 88.2%Others such as interns, EPWP, learnerships, etc 8 881 790 103 5 759 790 104 3 323 829 488 828 %u2013 828 250 055 828 273 286 828 295 786 828 309 096 %u2013 7.3% 0.8%Total 64 950 29 708 691 65 482 30 287 110 65 126 31 404 395 65 666 %u2013 65 666 33 221 494 65 668 35 339 375 65 679 36 412 163 65 687 38 035 817 0.0% 4.6% 100.0%1. Personnel numbers includes all filled posts together with those posts additional to the approved establishment Average annual growth over MTEF 2021/22 2022/23 2023/24 2024/25 2025/26 2026/27 2027/28 2024/25 - 2027/28Tables 31 and 32 above depicts departmental personnel numbers which are primarily made up of the posts declared in the PPN (Post Provisioning Norm) for schools (Programmes 2 and 4) and the approved Organogram for Office based support staff (Programme 1). Programme 5 provides for the employment of Grade R Practitioners in Early Childhood Development. Programme 6 personnel numbers, are the support staff to Infrastructure in terms of the Human Resource Capacitation project within the Education Infrastructure Grant. Programme 7 consists of the number of Exam assistants who support the year-end and supplementary examination processes. The overall wage bill has increased R29.708 billion in 2021/22 to a revised estimate of R33.221 billion in 2024/24, and further continues to grow in 2025/26 and over the medium term period. The continued growth in expenditure corresponds with continuous increasing trend in headcount numbers together with annual rise in Cost of Living Adjustment, thus increasing unit cost per head, averaged at R511 thousands. 359
